Anatomy of a Catastrophe

Using Imagery to Assess Harvey’s Impact on Houston

Storms happen suddenly. Disaster occurs slowly.

As Hurricane Harvey approached Texas, predictions of its potential damage to cities along the Gulf of Mexico were serious. At Planet, we began collecting and reviewing the most recent cloud-free imagery of the region. We knew that when the clouds parted there would be a need for pre- and post-storm satellite imagery and analysis.

Following the 180 billion dollar disaster, we have a better understanding of how governments, insurers, and first responders can use insights from imagery to improve risk analysis, relief efforts, and emergency preparedness with frequent data.

Data layers extracted

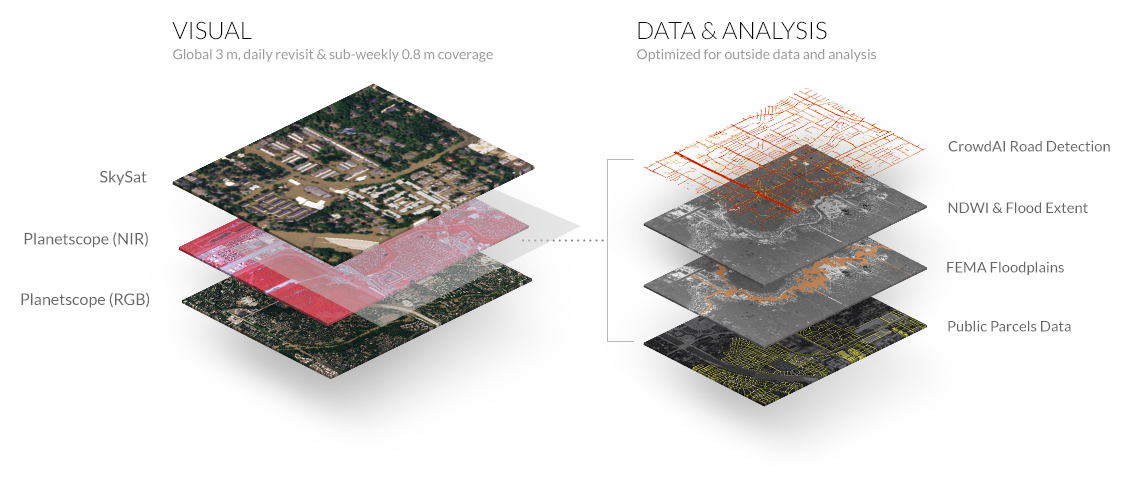
Planet’s daily monitoring of at-risk flood regions across the globe creates an up-to-date picture of localities that enable emergency management before, during, and after the disaster.

Frequent imaging enables insurance companies, local governments, and emergency relief groups to better model risk and improve response preparedness. Our fleet of medium and high resolution satellites provide daily insights on the impacts to industry, infrastructure, and residential and commercial property.

Houston: The perfect storm for a megaflood

Flooding on the outskirts of Houston, Texas, August 31, 2017 (Photo credit: South Carolina National Guard)

Modern-day Houston has grown into a man-made hazard for a mega flood. Beginning as a small settlement along the banks of the Buffalo Bayou, Houston has morphed into the 4th largest metropolis in the United States. Decades of rapid development, combined with the region’s low elevation and unique geography, have made the city vulnerable to extensive flooding.

Rainfall animation from the Integrated Multi-Satellite Retrievals for GPM (IMERG) courtesy of NASA Earth Observatory.
Acquired August 25 - 28, 2017

Hurricane Harvey: a once-in-a-millenium flood

Making landfall near Corpus Christi on August 25, Harvey battered Texas shores with 100+ miles-per-hour gusts and surging seas. When it was all over, Harvey would release unprecedented amounts of rainfall—over 50 inches in some areas–causing major flooding in Greater Houston.

The first look after the storm

With PlanetScope’s frequent daily coverage, Planet was able to capture one of the first broad-area, cloud-free images of Houston once the storm cleared on August 31.

Even after flooding peaked, flood water is visible across the cityscape, with heavy concentrations along Allen’s Landing and neighboring reservoirs. This timely imagery is needed for quantifying damage, directing relief efforts, and managing emergency response.

False color imagery increases contrast to make the most severely flooded regions clearly visible to the eye.

Water appears blue or black, depending on the amount of mud or other sediments suspended in the water. Trees and other vegetation are bright red, and houses and other buildings are gray, white, or tan.

“Normalized Difference Water Index” (NDWI) is an analytic method that can be applied to Planet imagery that uses our near-infrared band to accurately identify the presence or absence of water in broad areas affected by floods. Bright areas indicate standing water that is only visible in post-storm imagery.

FEMA’s Special Flood Hazard Area (dark blue regions) represents Houston’s 100-year floodplain—or more accurately—zones that have a 1 percent probability of flooding in a given year.

These rare 100-year events are becoming increasingly common, to the point that meteorologists may need new ways to properly communicate flood risk. Consider that Harvey is the city’s third “500-year flood” in the last century.

As we layer in our calculated flood extent (outermost layer), it becomes apparent that Harvey’s impact far exceeded the 500-year FEMA floodplain. Planet data derived from NDWI reveals flooding more accurately described as an “800-year” flood.

Assessing property damage and claims

Using PlanetScope imagery of the Greater Houston region and integrating public parcel data, we were able to conduct early estimates of which homes had been affected or spared shortly after peak flooding.

This data helps insurers estimate property damage and quickly resolve insurance claims. Timely and accurate recognition of property changes can expedite assessment, improve service, and enhance analysis at scale.

Estimating the extensive economic impacts

Evaluating the economic impacts of a hurricane the size of Harvey can be challenging, as the extent of the catastrophe can grow significantly in the aftermath given downed industry, transit, and civic operations. Planet’s 0.8 meter SkySat imagery allows us to take a closer look.

May 1, 2017

Motiva, the largest oil refinery in the US, was brought to a halt due to invasive flooding and operational risk. Even though the refinery was largely inaccessible after August 30, high-resolution imagery allows us to monitor its infrastructure.

September 1, 2017

September 9th, 2017

Two weeks later, only 50 percent of operations were restored, shown here on September 9. Frequent imaging provides up-to-date oversight of the facility as units come back online and the site is restored to again ramp up production.

Faster data, faster response

With daily imagery, calculating and assessing damage extents is possible shortly after catastrophe strikes. Cities and first responders can plan, prepare, and better respond to catastrophes with comprehensive information of what is happening on the ground as it unfolds.

Planet’s founding mission is to use space to help life on earth. As we collect more data about our planet, we learn the many ways it can help people plan for and better understand the impact of catastrophes, as well as create commercial efficiency in markets like insurance.

To learn more about Planet’s monitoring options, visit planet.com/products. To talk with a support specialist, visit go.planet.com/getintouch