
Using Planet Imagery for Mapping Arctic Landscape Change from Permafrost Thaw
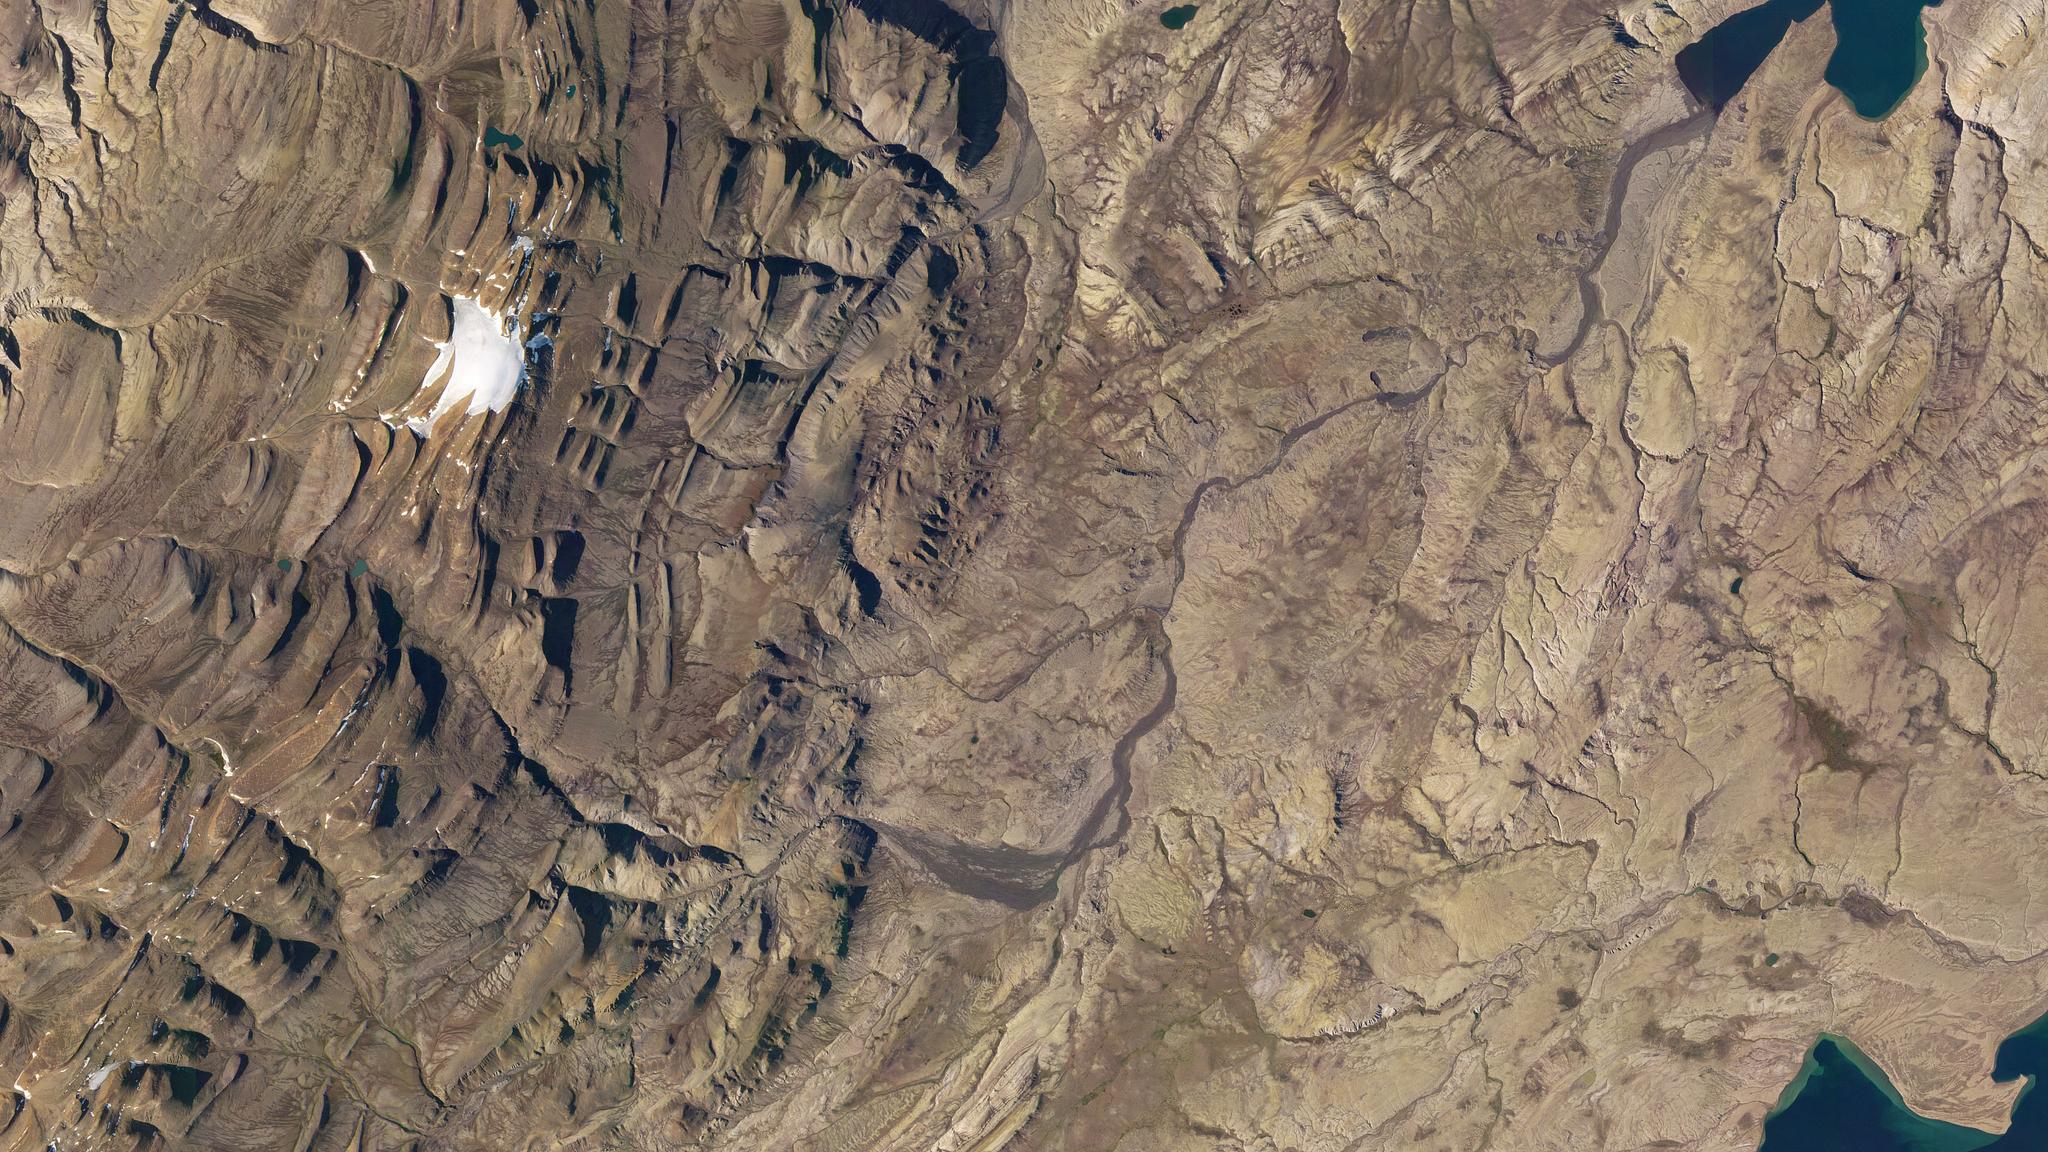
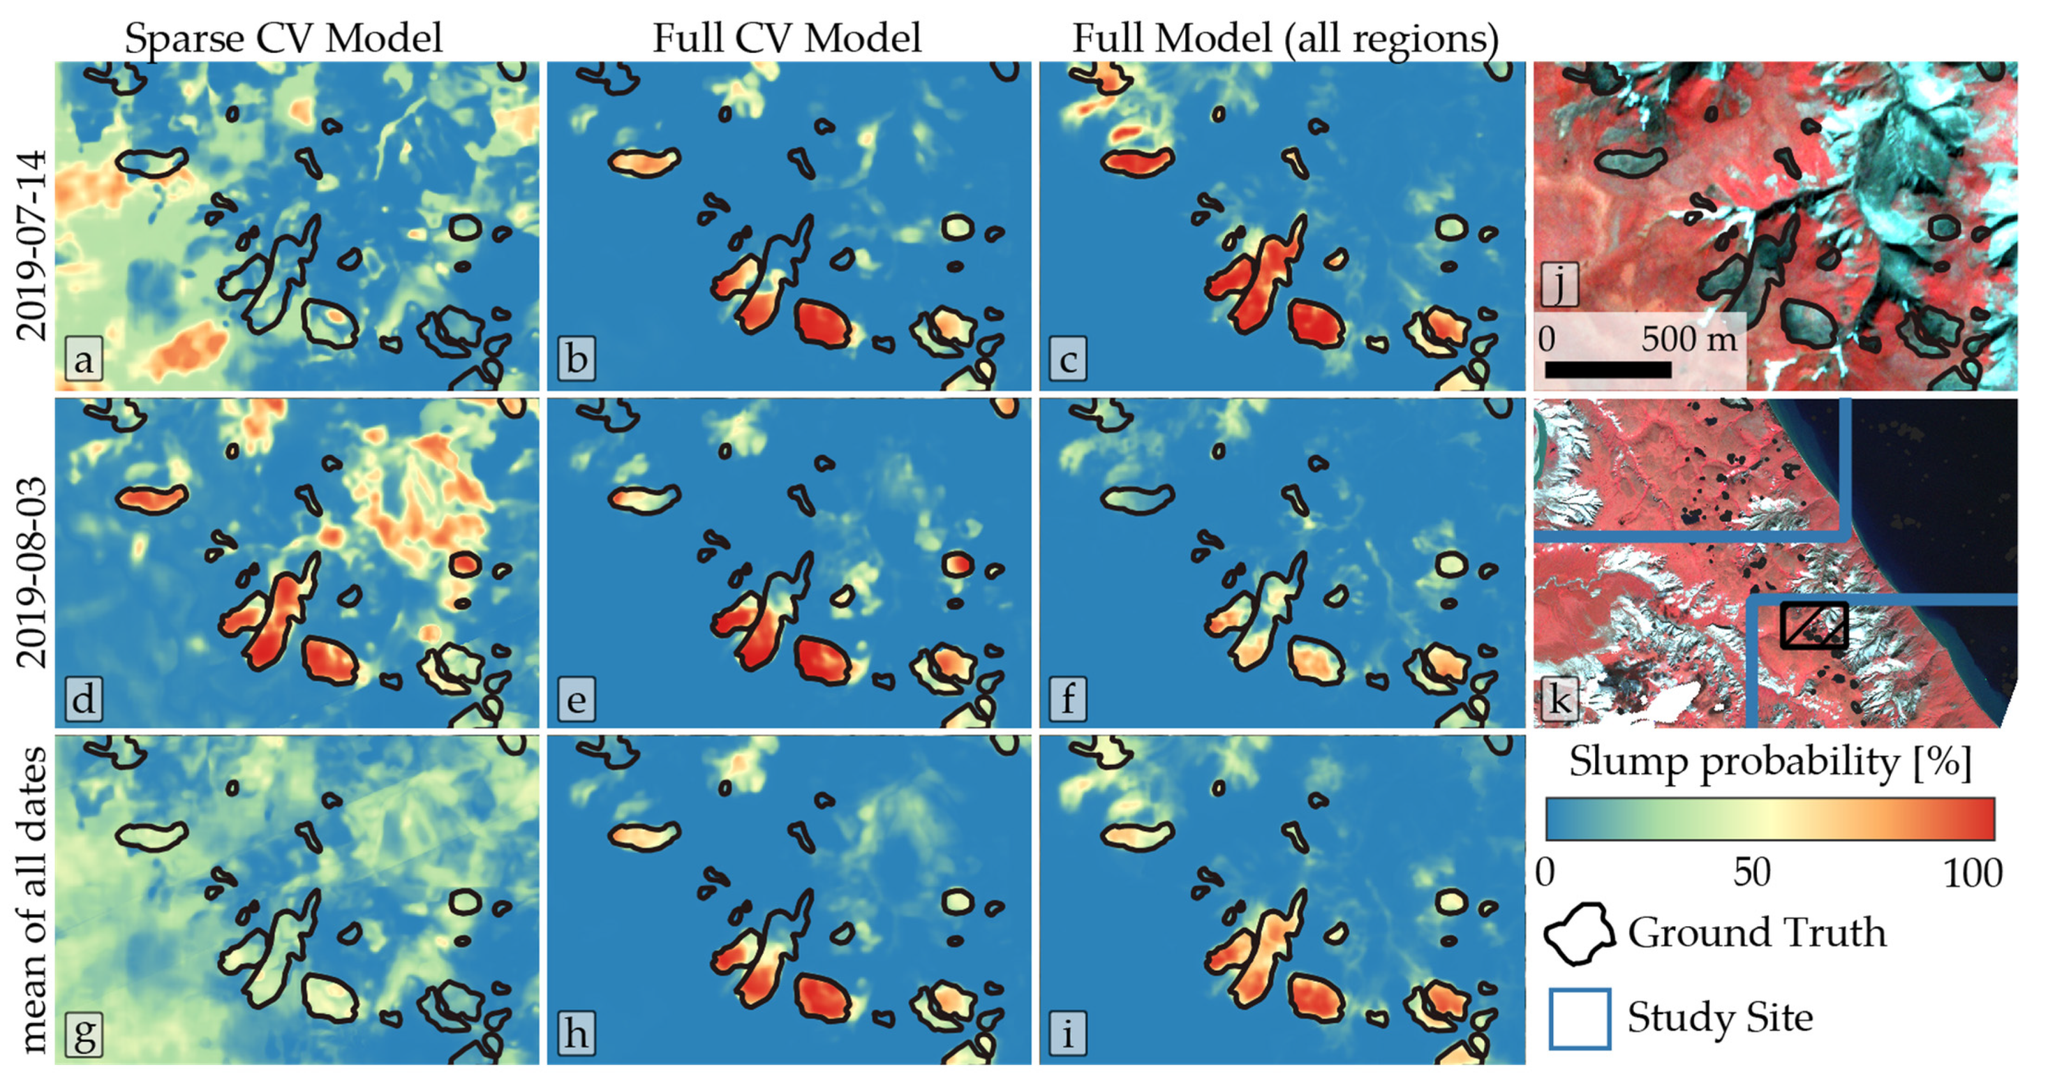
Permafrost is defined as ground that remains below freezing for multiple years in a row. This frozen ground is hard as concrete. However, rising temperatures from climate change are leading to thawing of this permafrost, impacting local ecosystems and infrastructure. Thaw also results in the release of significant amounts of methane into the atmosphere. Satellite imagery provides a way to monitor landscape changes due to permafrost thaw across the remote expanse of the Arctic. Researchers led by the Alfred Wegener Institute Helmholtz Centre for Polar and Marine Research and the University of Potsdam Institute of Geosciences released a pair of papers in which they used machine learning to map a key permafrost landscape change called retrogressive thaw slumps. These are (often <1 sq km) small landslide features that form when permafrost rapidly thaws on hillsides, destabilizing the ground. With increasing temperatures, these slumps are occurring more and more frequently. Utilizing PlanetScope imagery over Arctic Canada and Russia, Nitze et al. (2021) created a deep learning approach for automated mapping of thaw slumps. In the companion paper, Runge et al. (2021) analyzed Landsat 8 and Sentinel-2 data over Siberia using a disturbance detection algorithm called LandTrendr to map out thaw slumps. The results were then validated using higher spatial and temporal resolution PlanetScope and RapidEye imagery. The teams remarked, “With rapidly growing hardware capabilities and expanding data availability, the automated mapping and segmentation of [retrogressive thaw slumps] and other permafrost-related landscape features may be realized soon in order to better understand and predict the impact of climate change in the permafrost region.” The full studies can be found in Remote Sensing and Remote Sensing of Environment.
Ready to Get Started
Connect with a member of our Sales team. We'll help you find the right products and pricing for your needs.