
PlanetScope + Deep Learning Improves Understanding of Glacial Lake Risk
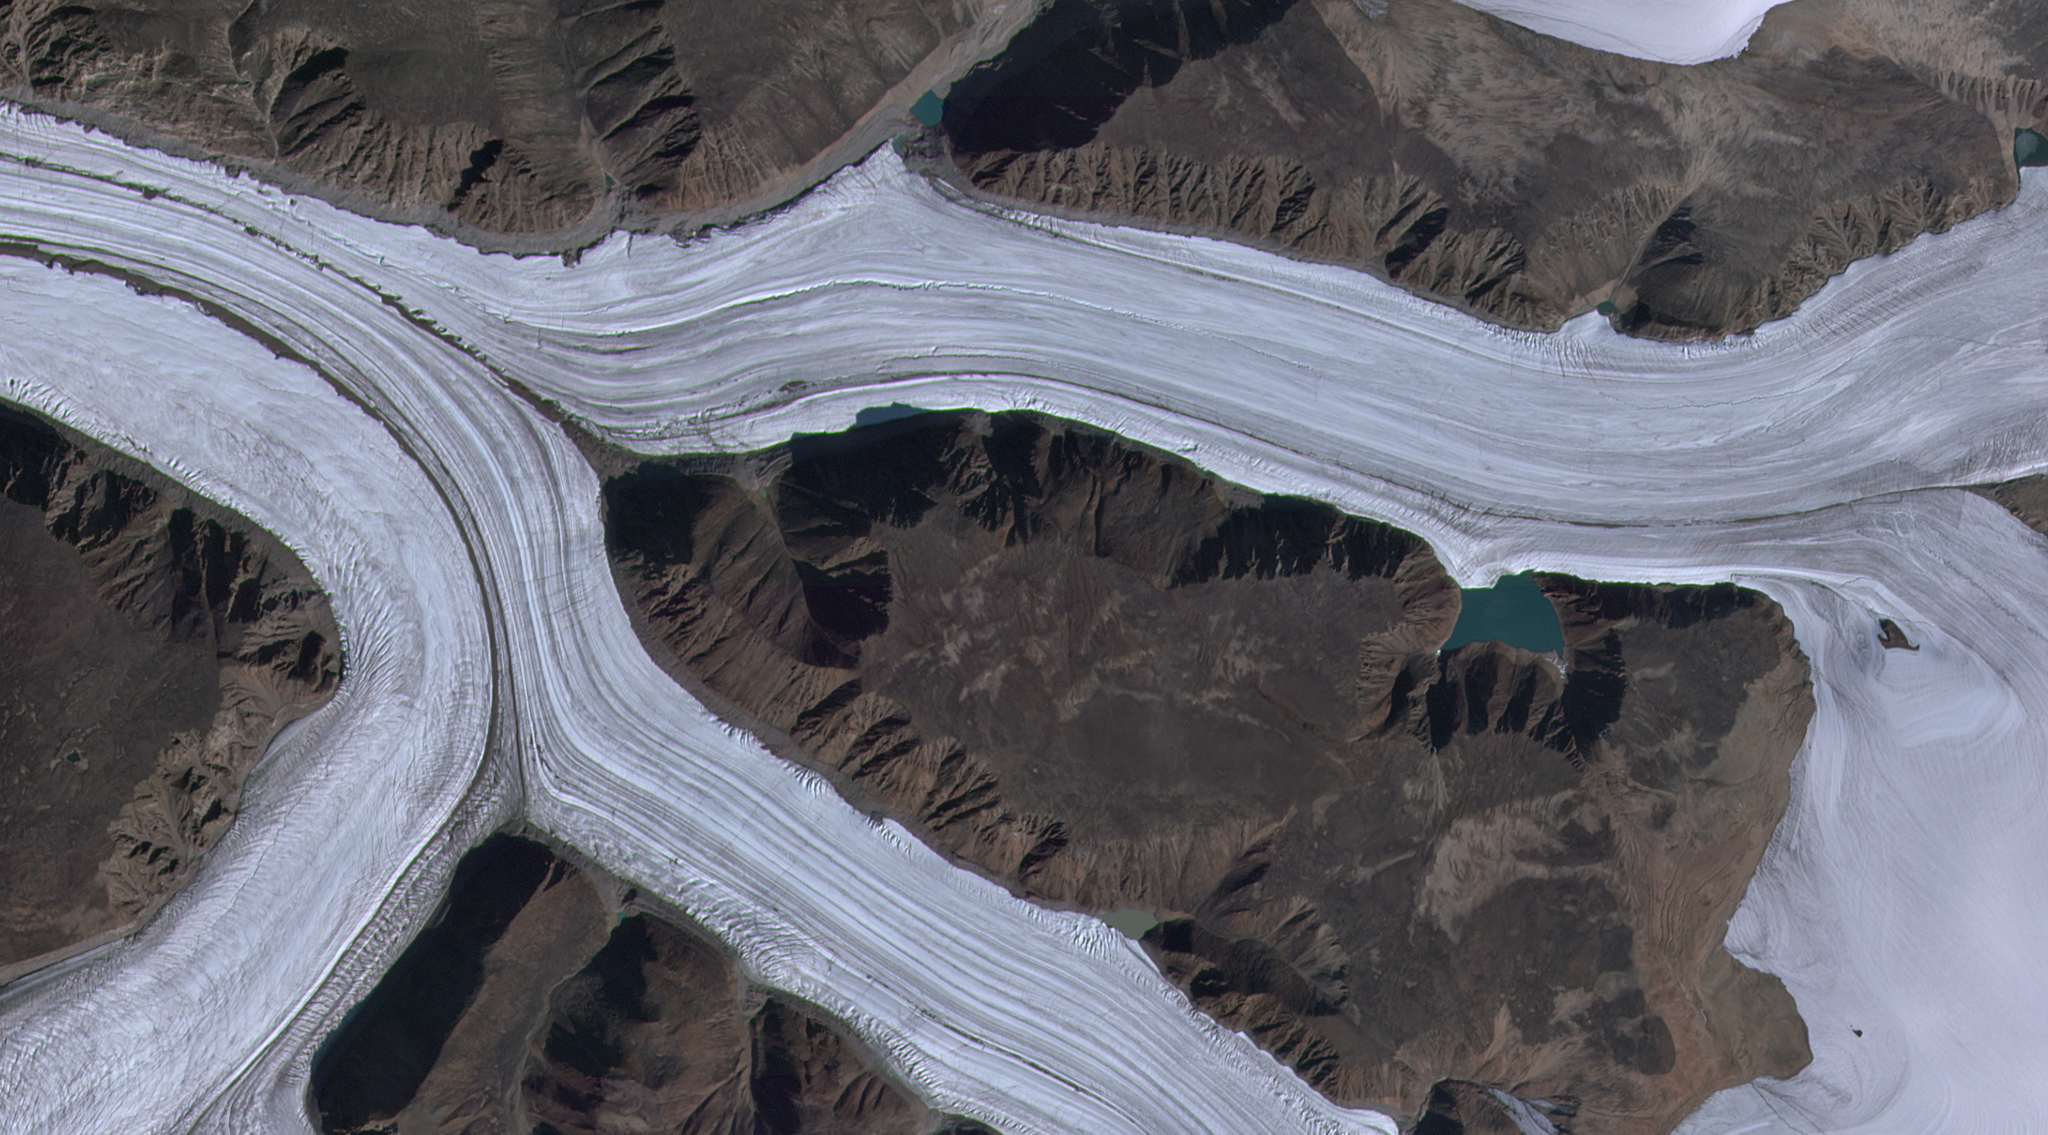
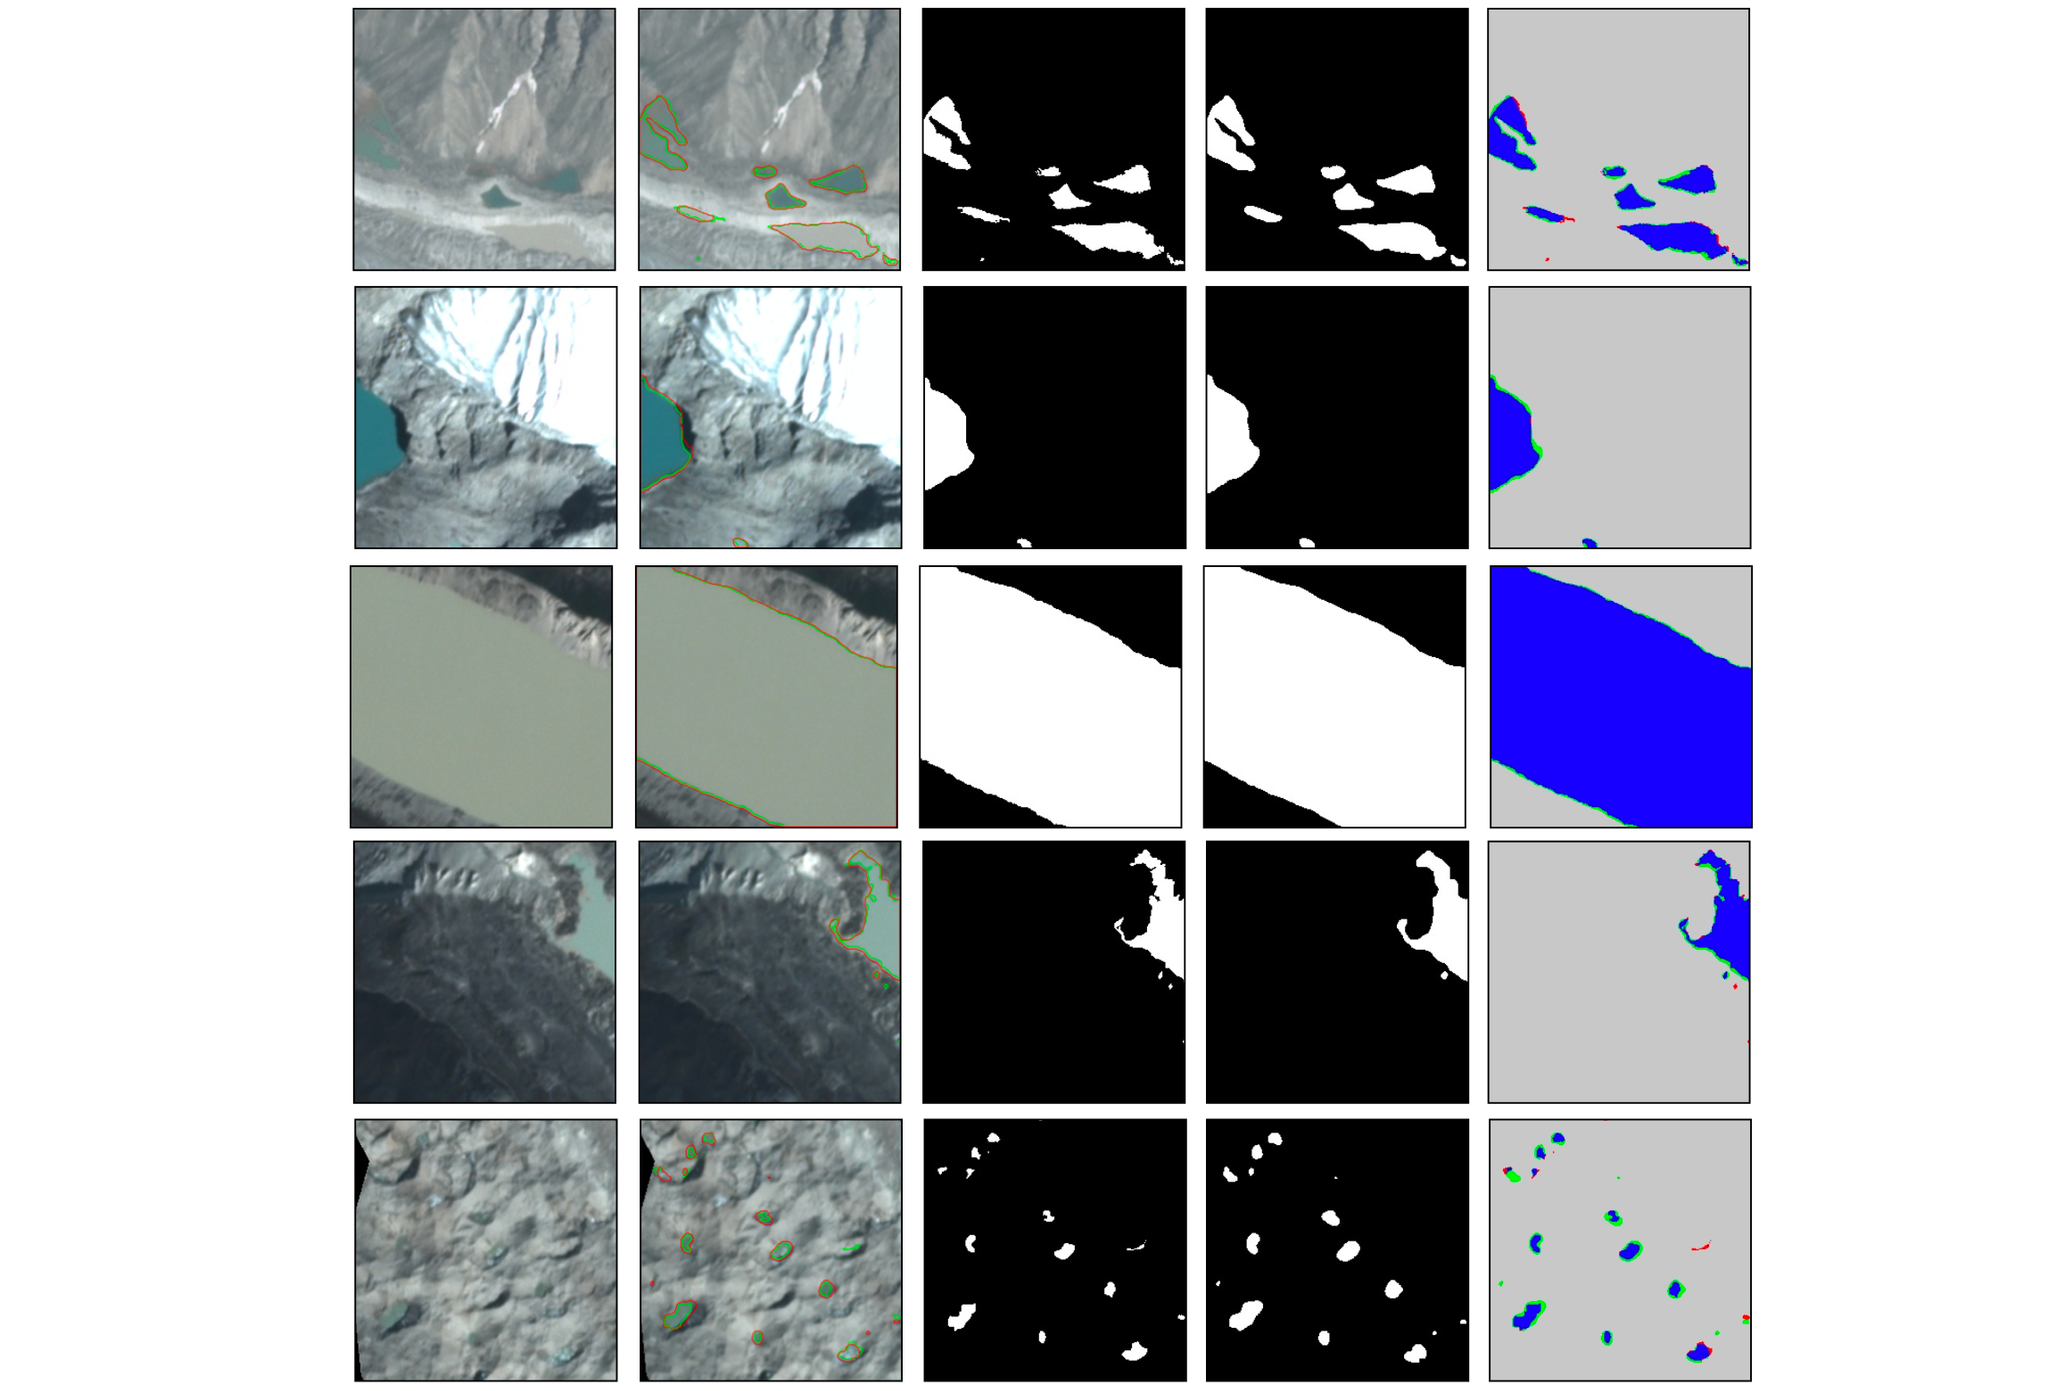
Glacial lakes in mountainous regions are prone to outburst floods that can devastate entire communities. With climate change, glacial ice is thinning and retreating in the Hindu Kush, Karakoram and Himalaya region, posing an increasing threat to human life and requiring improved monitoring. Nida Qayyum, in the Department of Space Science at the Institute of Space Technology in Islamabad, Pakistan, led a collaborative study using deep learning and a dataset of 5,000 hand-digitized lakes in the region. She leveraged PlanetScope imagery, in combination with Landsat 8 and Sentinel-2 data. Qayyum and team compared multiple machine learning approaches for accuracy in identifying new lakes (i.e. unseen data), including a U-Net architecture (modified to ingest four spectral channels of PlanetScope), Random Forest, and Support Vector Machine classification. Qayyum et al. reported that “the U-Net with EfficientNet backbone achieved the highest F1 Score of 0.936” and that “the deep learning model detected significantly more lakes than the existing inventories, which have been derived from Landsat OLI imagery.” “The results show that higher spatial and temporal resolution of PlanetScope imagery is a significant advantage in the context of glacial lakes mapping and monitoring.” Based on time-series analysis from known outburst floods, the authors argue the model will be valuable to mitigate future risk. Qayyum et al. conclude that “Such events have occurred in the past and it is imperative to monitor such situations using remote sensing datasets. The automation of the whole process is essential as this region spreads over a large area and it is not possible to visually inspect the whole area.” The full paper, which is open access, can be found in the International Journal of Geo-information, an ISPRS journal. [caption id="attachment_145989" align="aligncenter" width="2296"]
Ready to Get Started
Connect with a member of our Sales team. We'll help you find the right products and pricing for your needs