

How Is Historical Satellite Imagery Used to Detect Change and Trends?

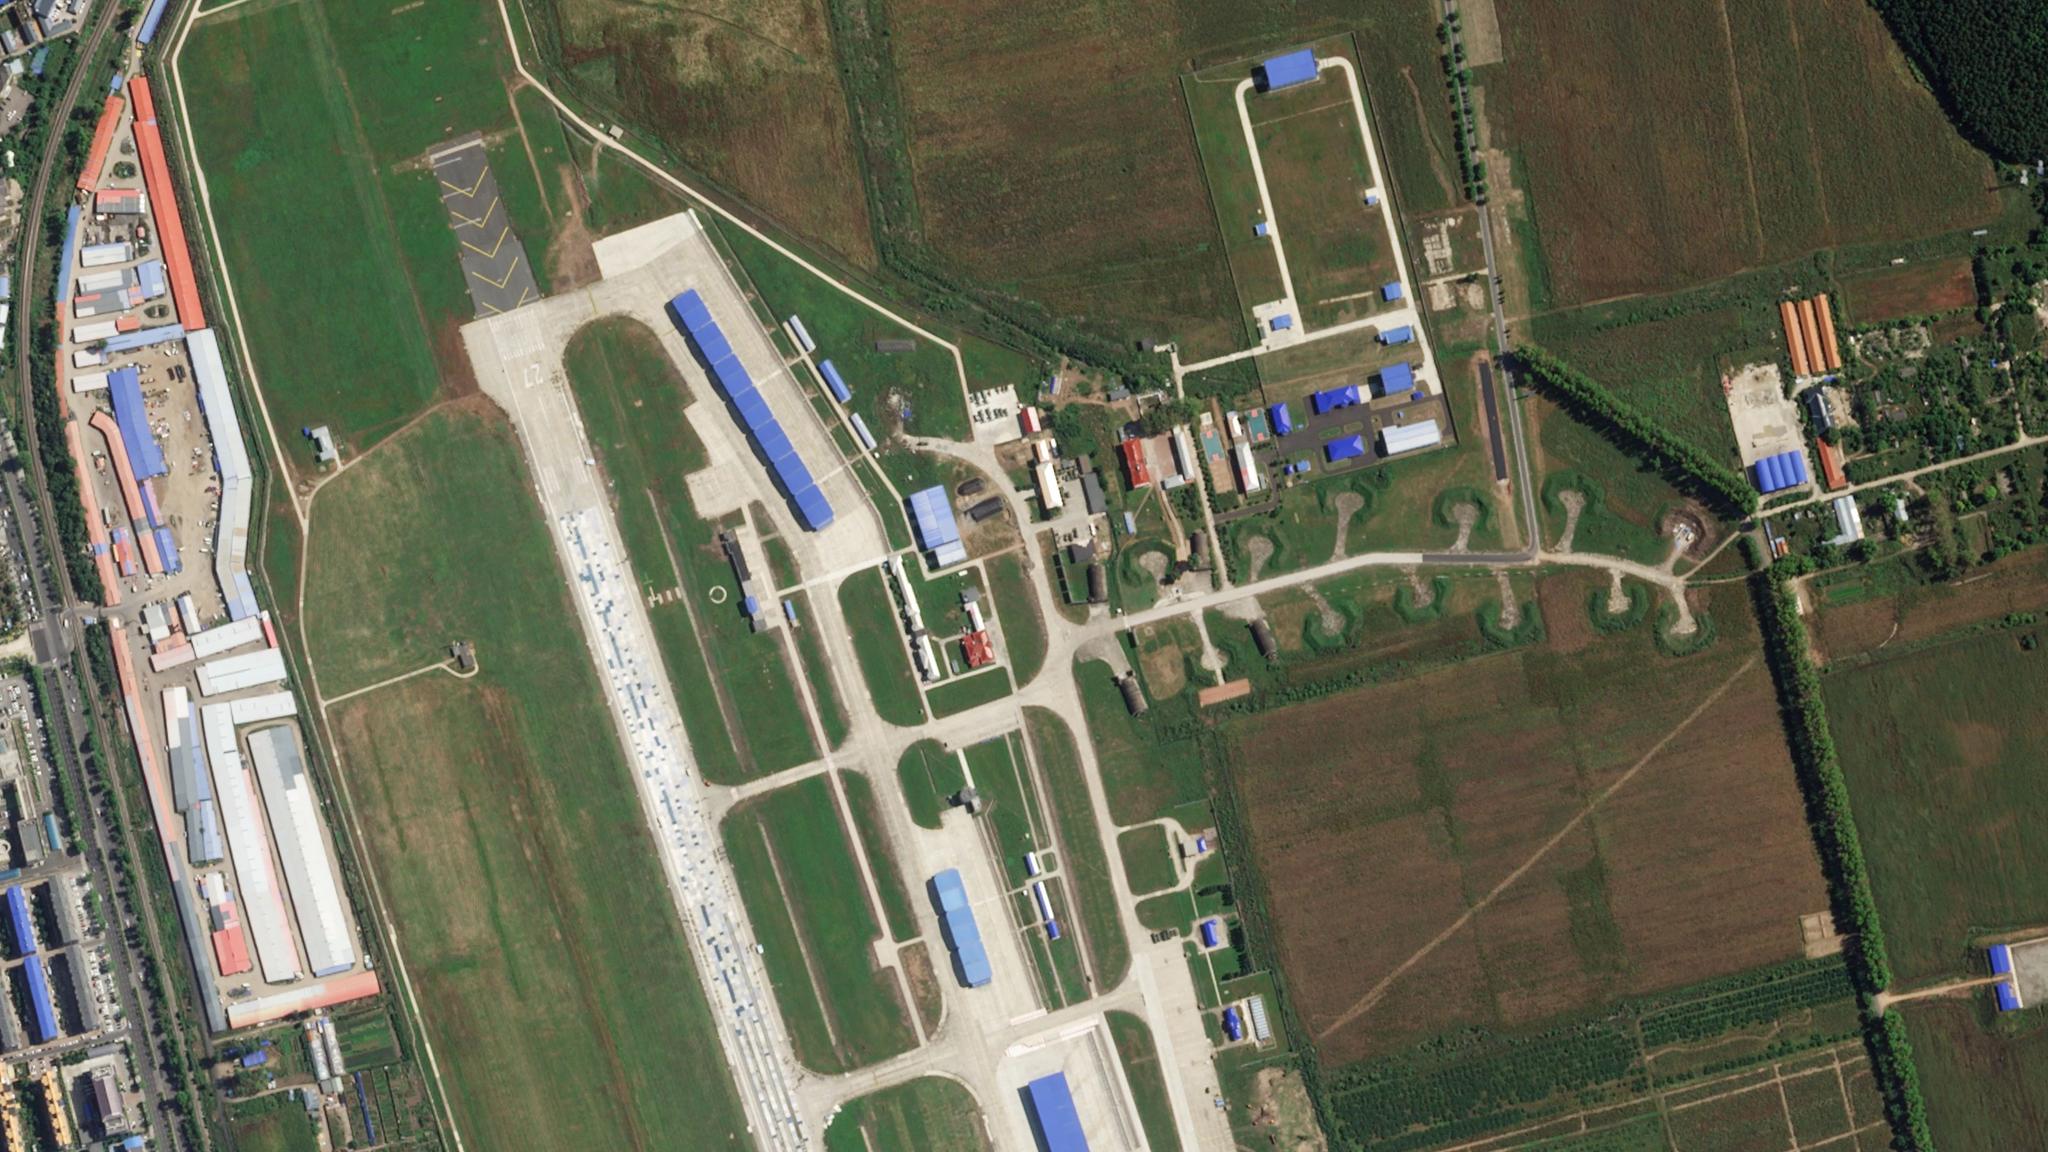
Pelican image an airfield in Yanji City, China, captured September 21, 2025. © 2026 Planet Labs PBC. All Rights Reserved.
EducationIf a single satellite image is a witness to a moment in time, then an imagery archive can serve as a time machine. Every corner of our planet has a rhythm, or a baseline of activity that defines its day-to-day reality. And when we compare that snapshot to past conditions, a valuable story can emerge.
For defense and intelligence agencies working to advance peace and security, this historical perspective is a critical strategic asset. An extensive archive of satellite imagery allows operators to map a pattern of life, giving them data to detect unusual troop movements, monitor infrastructure development, or validate emerging threats.
With Planet’s 10+ year archive of daily satellite imagery covering Earth’s entire landmass, analysts aren't just looking at where a crisis stands today; they are leveraging a living dataset of global change. This historical depth empowers organizations to look backward to see forward, ultimately minimizing risk and accelerating mission-critical decision-making.
Using Historical Satellite Imagery Used to Detect Change Over Time
Archival satellite imagery provides a visual record to compare past and current conditions across the Earth. This longitudinal view provides continual insights into where and even why change is happening; and a deeper understanding of human and environmental activity.
Sometimes only a pair of images is enough; for example, the pair of images below taken before and after a flood along the Rio Sinu near Tierralta, Colombia show the extent of impact.
These PlanetScope images were taken on January 24, 2026 and February 4, 2026.
Other analysis benefits from a longer view - such as this time series of Long Beach port in Southern California, which uses images from June 2017 to April 2024.
Loading Video...
Timelapse of Long Beach port, California, consisting of 149 PlanetScope images.
Whether you have just a pair of images or hundreds, there are limitless ways to use historical satellite imagery to understand change, from trends in land use, agricultural health, and urban development, to aircraft activity and military movements.
Using Historical Satellite Imagery to Support AI-Enabled Solutions
Similar to other powerful datasets, the value of historical satellite imagery is exponentially multiplied when combined with artificial intelligence (AI). Take for example Planet Global Monitoring Service, or Planet GMS.
Leveraging 10+ years of near-daily Planet imagery and AI-powered algorithms, the platform detects change in near-real time and uses automated alerts to help agencies strengthen early warning capabilities and accelerate response time.
Defense and intelligence agencies use Planet GMS to monitor a range of key sites and elements, including aircraft, vessels, roads, buildings, and borders.
Loading Video...
Identify anomalies to inform decisions and take action with AI- and ML-driven analysis at scale.
Across industries and dozens of use cases, historical satellite imagery builds a chronological record of activity across the Earth’s surface, at different points in time.
Learn More
The questions and answers below have more about historical satellite data. Or, if you’re interested in learning how archival imagery can advance your strategic priorities, reach out to us! We’d love to hear from you.
Questions You Might Have
High-resolution satellite imagery generally dates back to the late 1990s and early 2000s when the first commercial sensors began orbiting the planet.
Before this period, Earth observation relied primarily on lower-resolution government systems that captured broader regional views rather than specific local details. Modern archives now contain trillions of pixels that document the transition of cities and ecosystems with increasing frequency. This growing library ensures that today’s projects can be measured against a clear digital baseline from the recent past.
Key Takeaway: The era of high-resolution digital imagery began in the late 1990s, providing a quarter-century of detailed data for change analysis.
A baseline represents a starting point or a reference state used to measure subsequent changes in a specific area. It matters because without a known historical standard, it is impossible to determine if current observations represent a normal cycle or a significant deviation.
Establishing a baseline allows scientists to quantify the rate of forest loss, the speed of coastal erosion, or the growth of an industrial zone. This reference point provides the necessary context for interpreting new data and making predictions about future conditions. A stable baseline ensures that any measured progress or decline is grounded in factual comparison.
Key Takeaway: A baseline serves as the essential reference point that allows for the accurate measurement and quantification of environmental or structural changes.
Satellite data can measure a wide variety of long-term trends, including deforestation rates, glacier retreat, urbanization, vegetation health, and atmospheric pollution levels. Researchers track the multi-year health of agricultural heartlands to see how soil quality and water availability fluctuate across different climate cycles. Urban planners monitor the steady conversion of rural land into residential areas to manage the demands on local infrastructure over decades.
These datasets also capture the environmental impact and gradual recovery of an ecosystem after a disaster like a wildfire or hurricane. By analyzing these persistent movements, organizations can develop strategies that address the root causes of regional shifts.
Key Takeaway: Long-term data allows for the tracking of persistent global shifts such as urban growth, glacial retreat, and agricultural health cycles.
A scientifically reliable satellite dataset maintains consistent spectral calibration and geometric accuracy across different time periods. This consistency ensures that a change in the image reflects a real change on the ground rather than a variation in the sensor’s performance.
Reliable data must also be captured at a regular frequency to avoid missing critical events that occur between observations. Standardized processing methods are applied to remove atmospheric interference so that images from different seasons can be compared accurately. These technical standards provide a trustworthy foundation for researchers to draw valid conclusions about the state of the planet.
Key Takeaway: Scientific reliability depends on consistent calibration and standardized processing to ensure that imagery accurately reflects physical changes on the ground.

Ready to Get Started
Connect with a member of our Sales team. We'll help you find the right products and pricing for your needs.