
Planet Superpowers: Looking Deeper
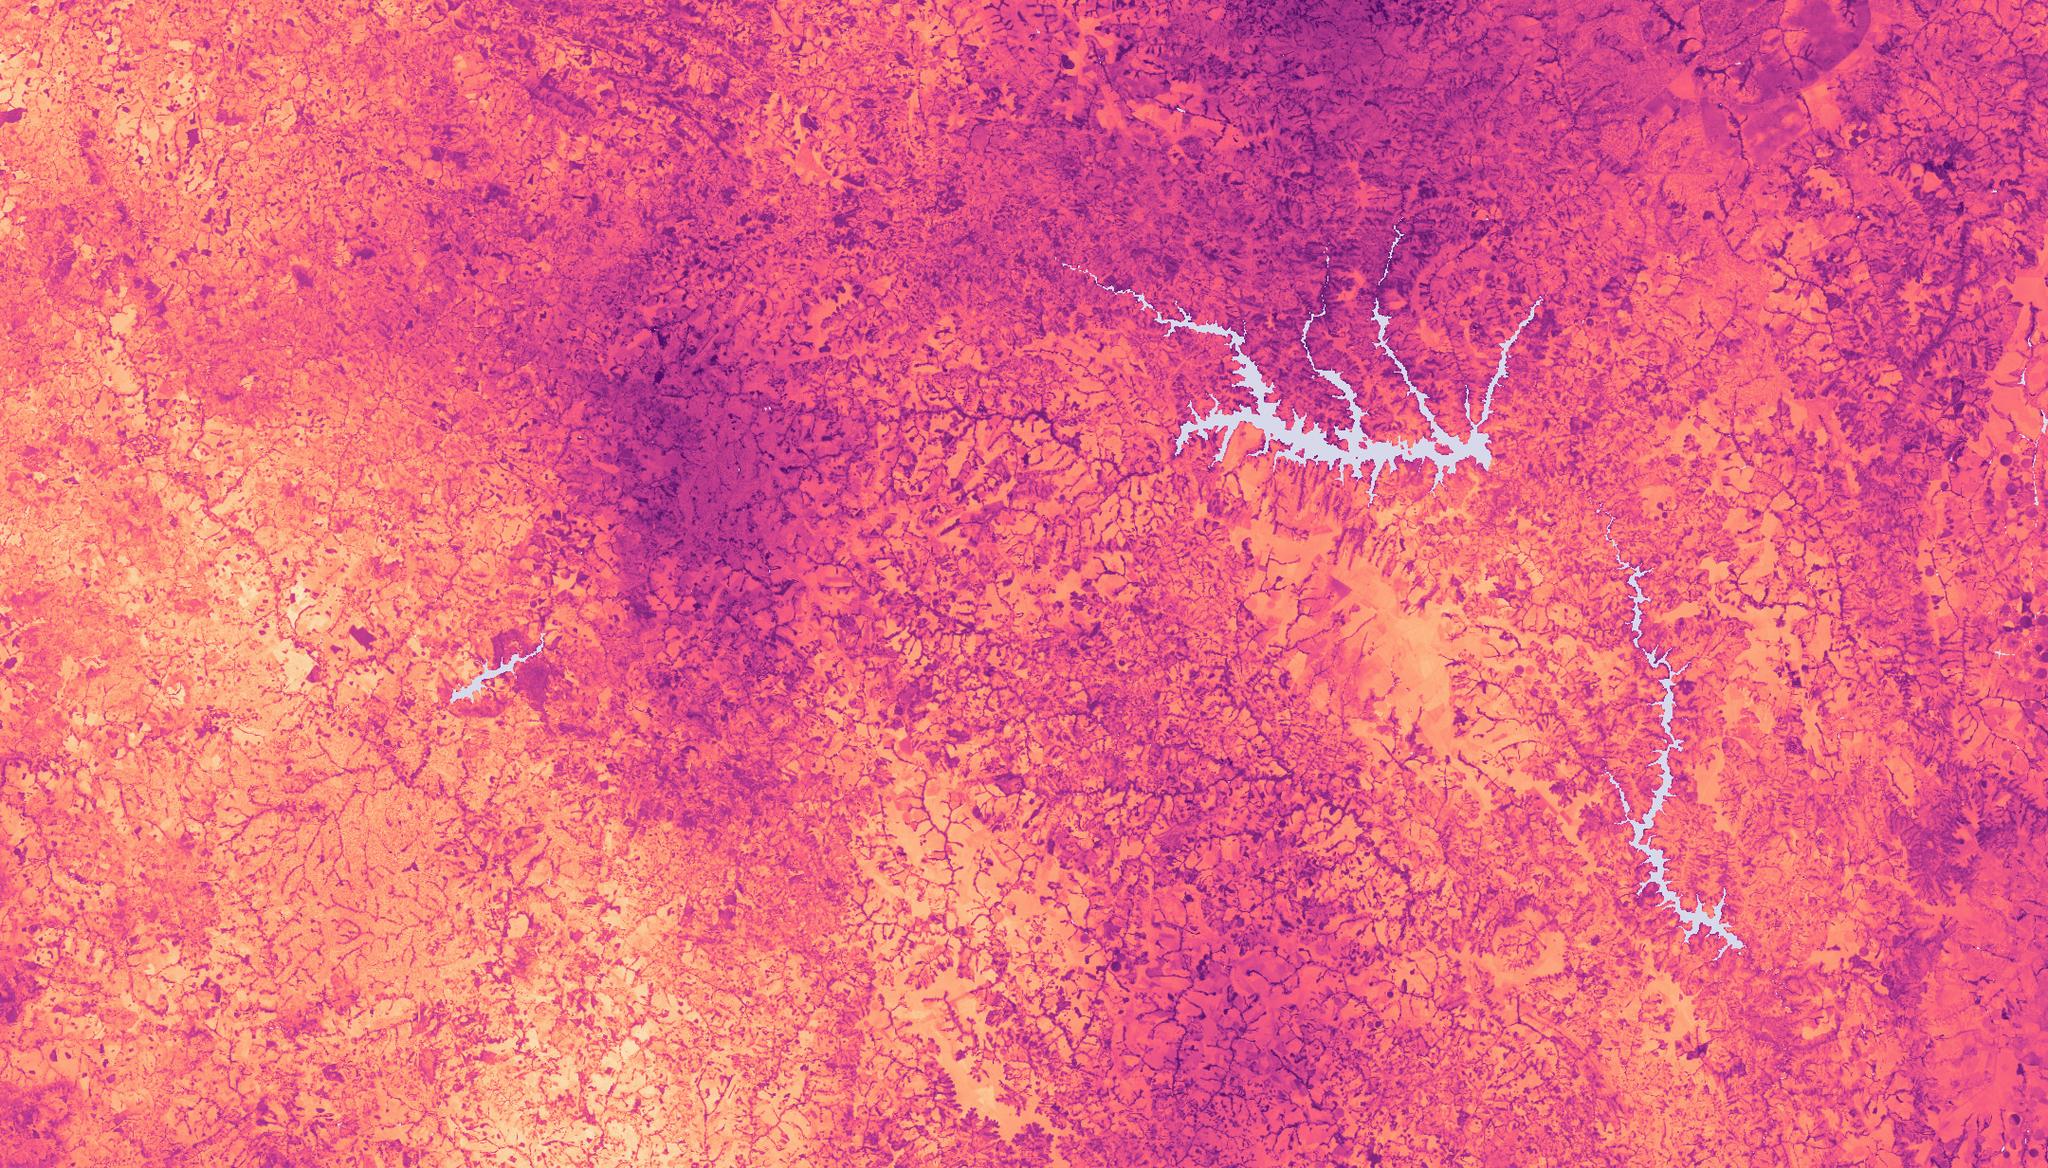
Land Surface Temperature as observed on October 29, 2023 over part of Goiás, Brazil. © 2023 Planet Labs PBC. All Rights Reserved.
TechLook deeply into a place, event, or object in a way that characterizes its physical attributes over time — which are sometimes invisible to the naked eye.
Earth observation (EO) data has revolutionized how governments, companies, and organizations understand the climate patterns, human activity, economies, and natural resources that matter most.
This includes the ability to look deeply into a place, event, or object in a way that characterizes its physical attributes over time, which are sometimes invisible to the naked eye.
In previous posts we’ve explored how EO imagery allows us to look back, more broadly, and more closely at our planet’s complex systems. Now let's focus on how satellite imagery can also allow us to look deeper, through the analysis of multi-spectral bands.
EO Data and Broad Area Management
EO data is central to broad area management, which is the practice of monitoring, measuring, and reporting on assets, whether natural or man-made, across broad geographies and timescales.
But EO data is almost always more than meets the eye. Most optical satellites image in multiple spectral bands — they’re capable of not just "true color" imagery, or imagery that looks like what a human eye would see — but probe various segments of the electromagnetic spectrum.
This approach means that satellite data contains hidden layers of information, enabling analysis of myriad processes and developments — from land cover identification and vegetation health to classifying sediments in lakes and rivers and detecting algal bloom.
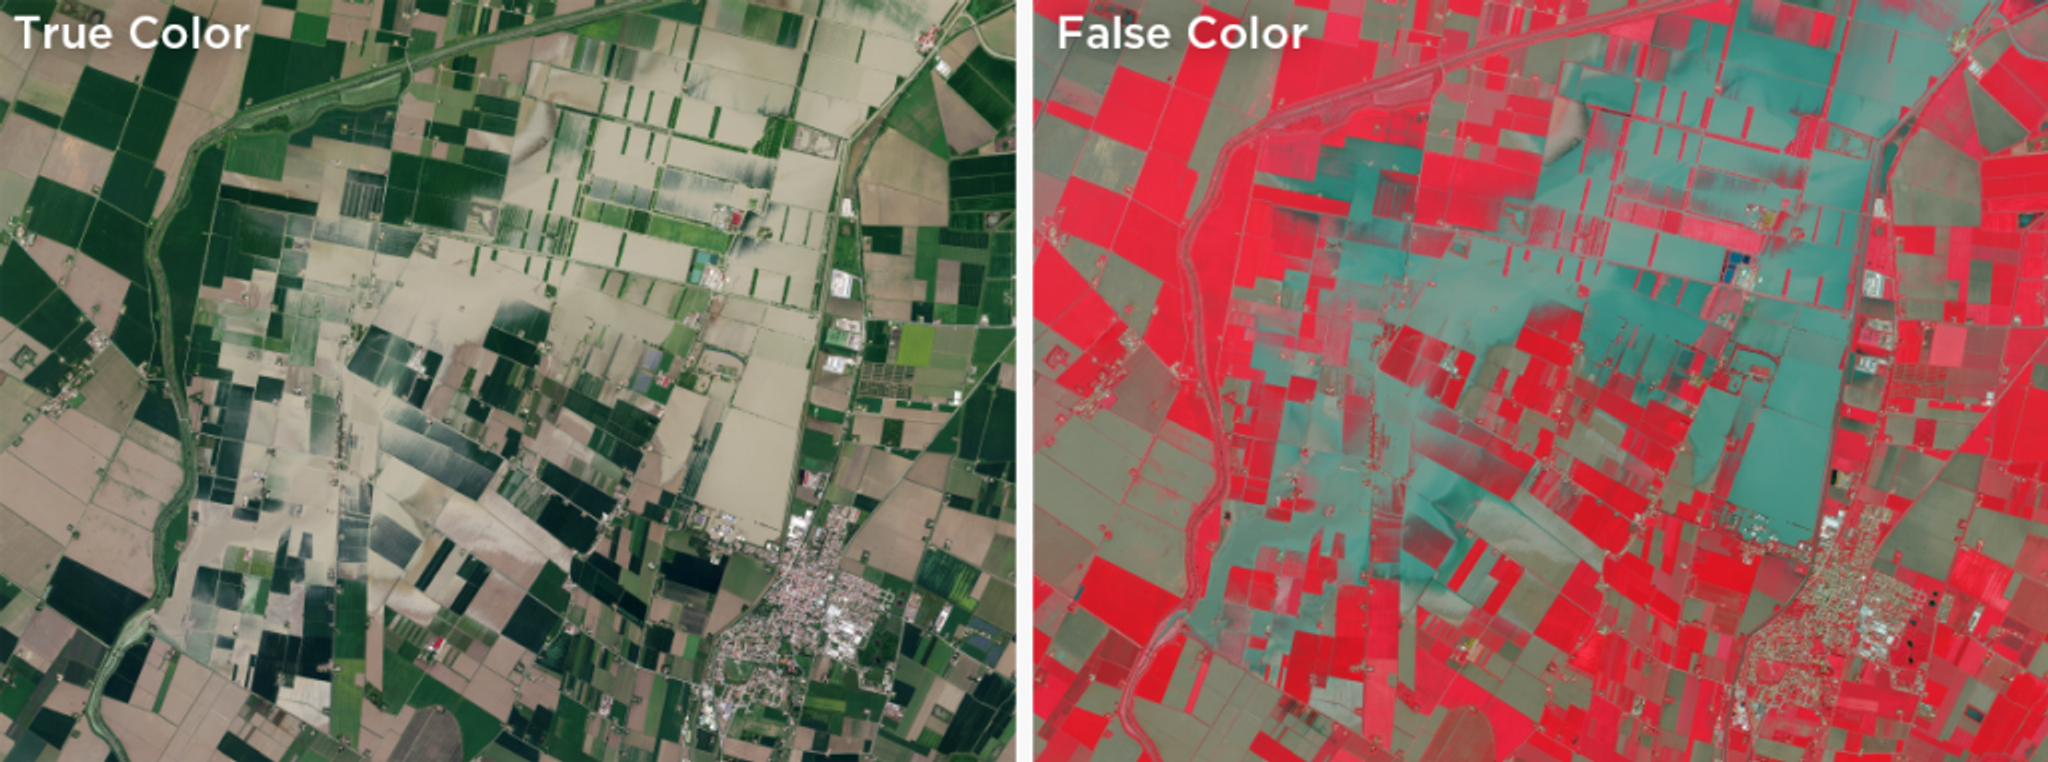
Flooded areas, indicated in light blue, are easier to identify in a false color composite using data from the near-infrared, red, and green bands (right image) than in true color imagery (left image). Both of these images were collected by the same satellite on May 4, 2023, near Conselice, Italy.
And when this capability is applied to broad area management, we’re able to understand physical attributes across the Earth in a much more sophisticated way. Through multispectral analysis across space and time, we’re able to look deeper and convert raw observations into quantifiable metrics.
From Imagery to Measurements: Planetary Variables
Planetary Variables™ data reveals biophysical properties, measured over time from a range of satellite data missions. This data is powerful because it measures phenomena — Soil Water Content, Land Surface Temperature, Crop Biomass, and Forest Carbon — translating raw observations into quantifiable metrics.
Multiple public satellite missions scan the globe from across the electromagnetic spectrum, with techniques ranging from optical, radar, passive microwave, and lidar sensors, revealing different aspects about the physical properties of earth. The Planet team has developed advanced algorithms that process satellite data from Planet and from public constellations to produce information that is usable without the need for extensive data cleaning and processing.
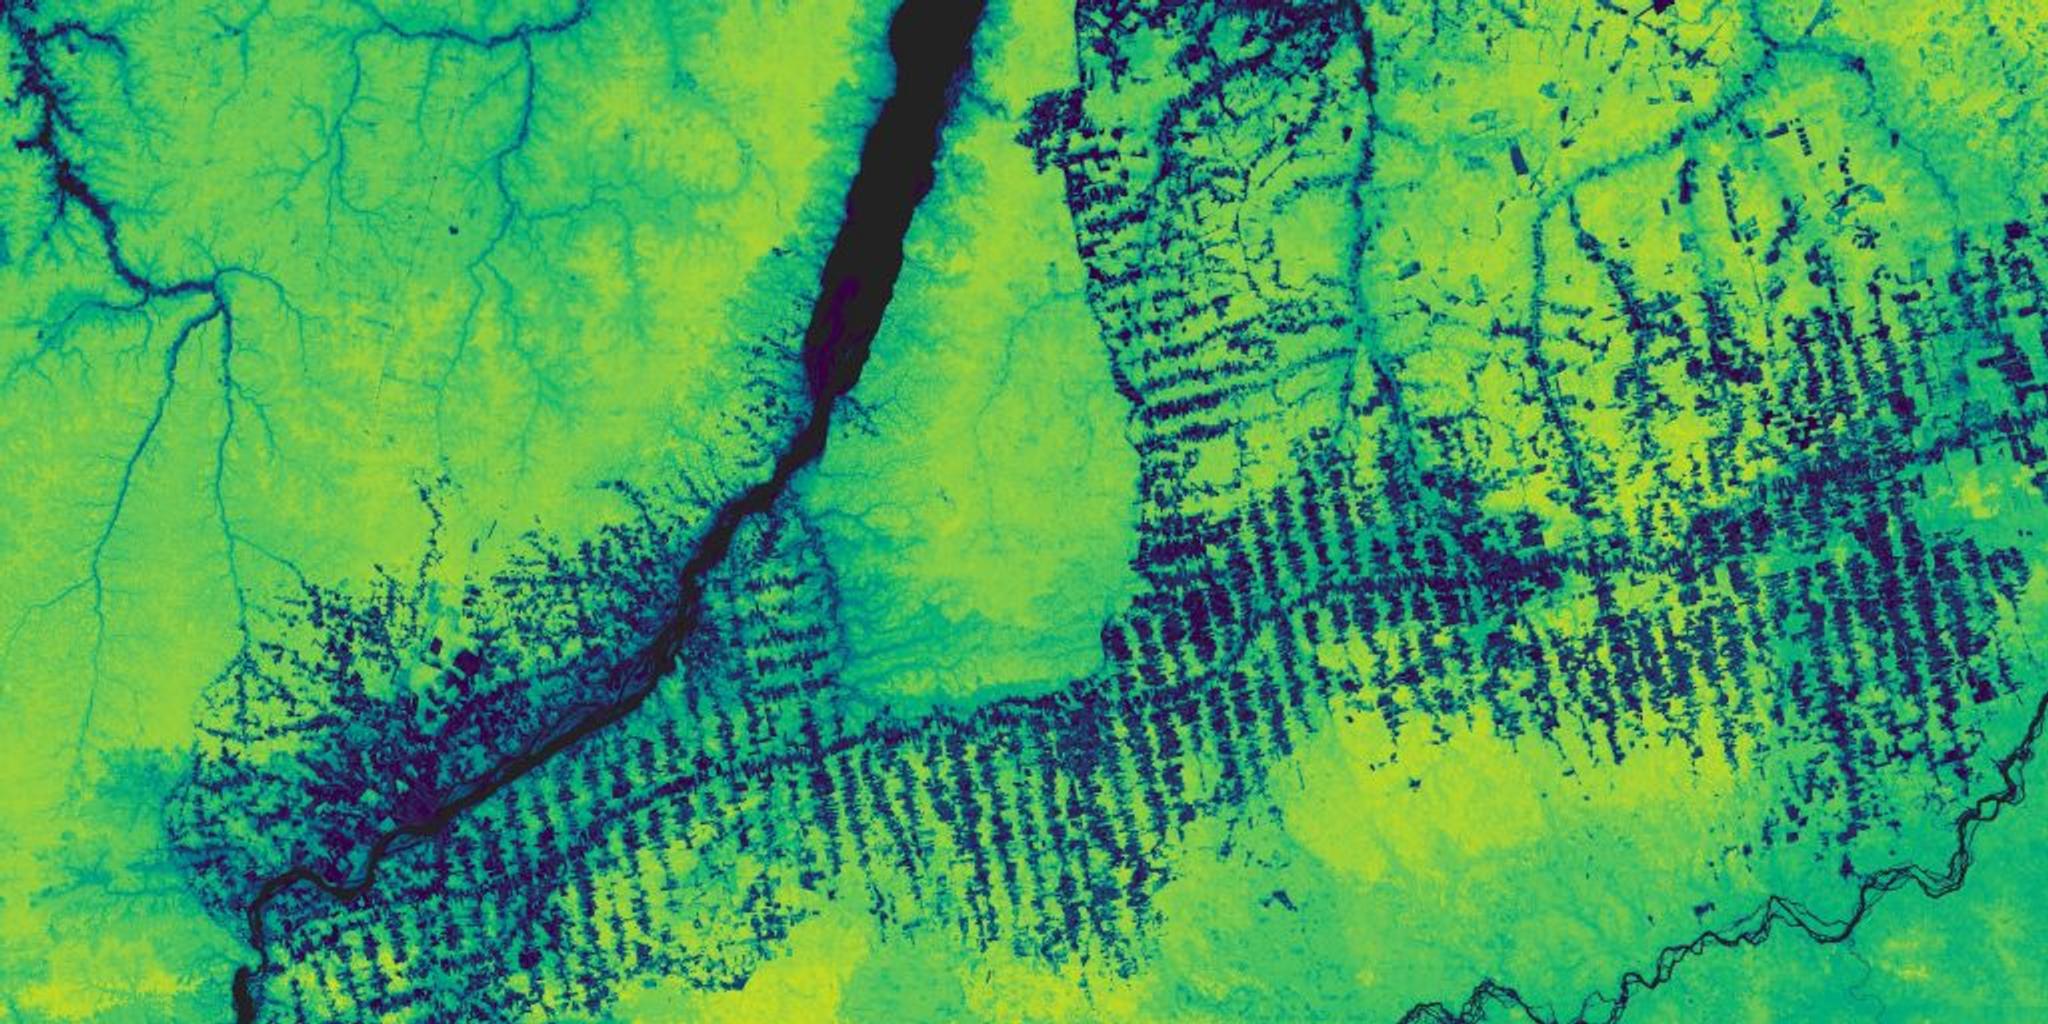
Above ground forest carbon near the Tapajós River in Brazil.
By fusing these distinct sources together, Planetary Variables data unlocks information about key characteristics about the Earth. These datasets offer concrete data points for evaluating ecosystem services, assessing agricultural productivity, and monitoring climate change impacts, bridging the gap between satellite observations and practical applications.
Planetary Variables in Practice
Let’s look at the ability to look deeper, in practice. For a government water agency monitoring agricultural areas, for example, this ability becomes a pivotal tool — especially when assessing water demand, water availability, or soil moisture conditions amidst the challenges of droughts or floods.
Rather than relying solely on in-situ sensors or conducting time-consuming on-site visits, the agency can evolve to have a more efficient and comprehensive monitoring approach. Harnessing remote sensing that draws on microwaves, Planet produces a reliable measurement of the amount of water in the soil with its Soil Water Content data layer.
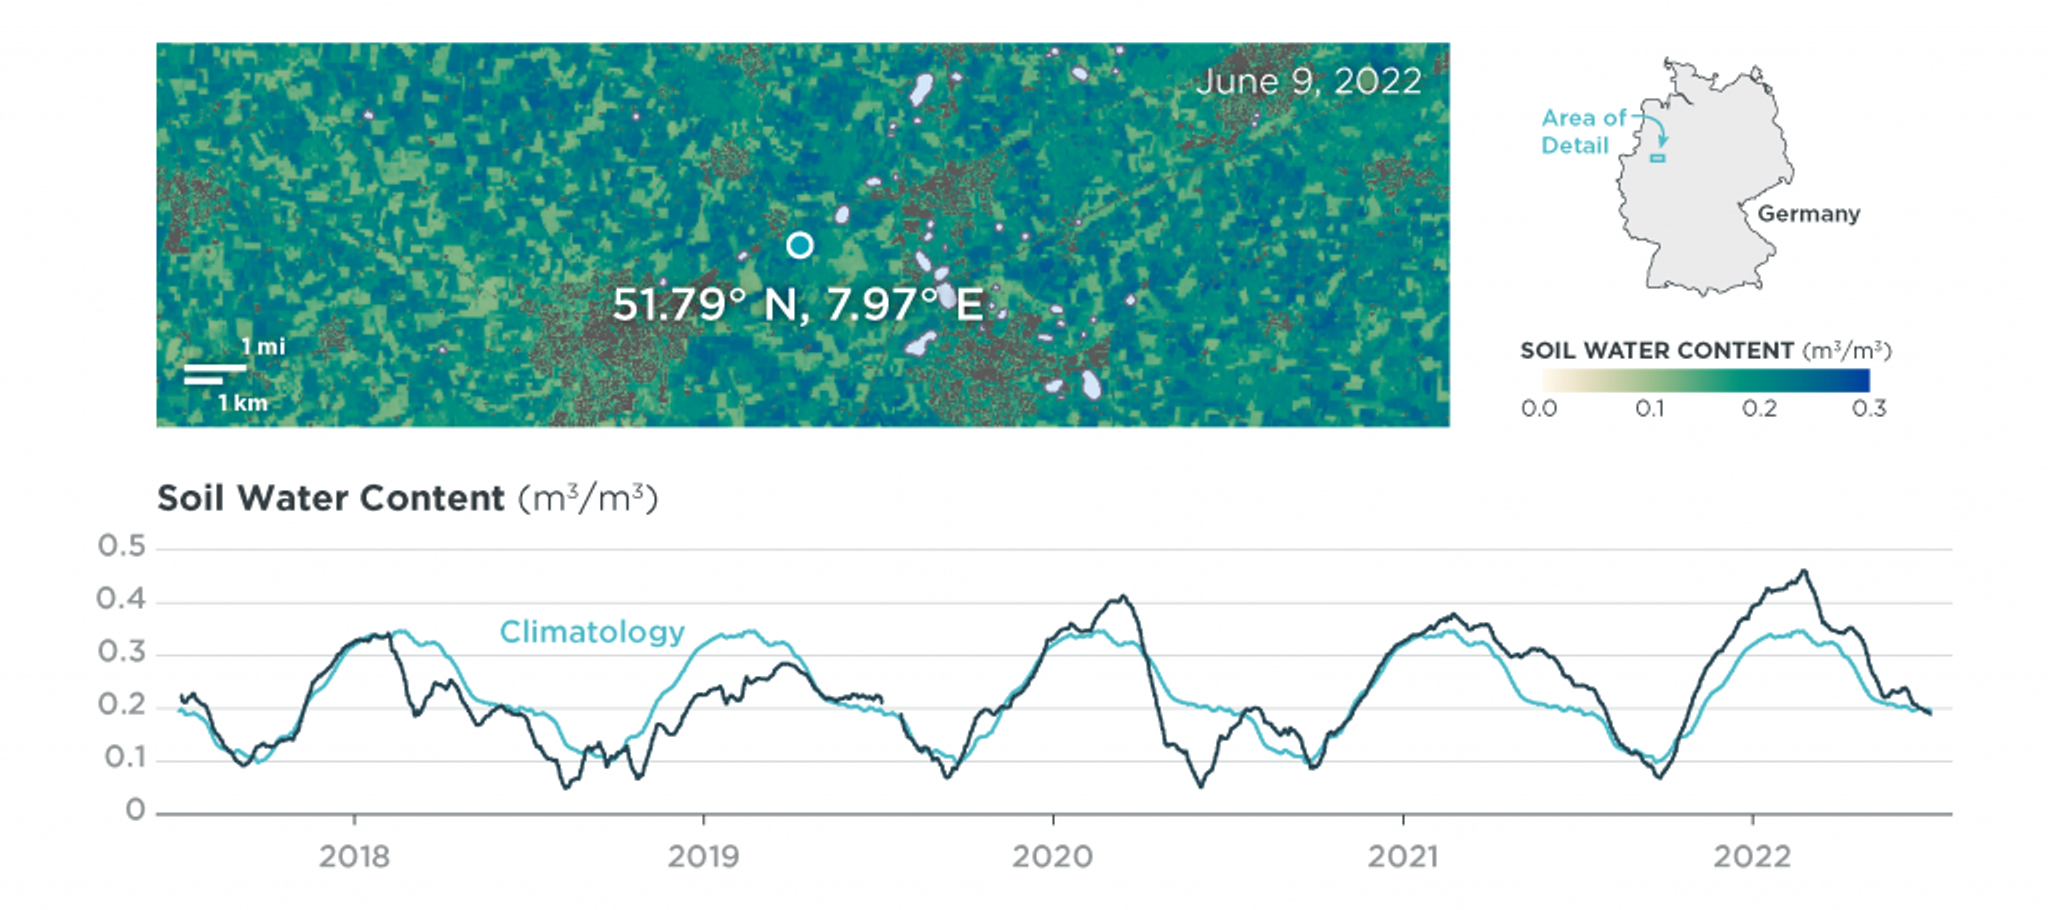
Measurements of soil water content near Ahlen, in North Rhine-Westphalia, Germany.
Soil Water Content allows organizations to monitor complex water systems by providing insights in water demand and storage capacity. Planet processes data from satellite sensors that measure passive microwave radiation, delivering near-daily measurements.
With two decades of measurements in the archive, water resource managers can understand what’s normal and what’s not, tracking droughts, measuring soil saturation, and assessing the effects of interventions with tangible, meaningful data points. The agency not only keeps abreast of current conditions, but also gains the ability to predict and prepare for future water needs, safeguarding both ecosystems and agriculture.
These datasets offer concrete data points for evaluating ecosystem services, assessing agricultural productivity, and monitoring climate change impacts, bridging the gap between satellite observations and practical applications..
Looking Deeper With Planet
As we confront the escalating challenges of a changing world, the role of advanced EO technologies becomes increasingly critical. The impact oflooking deeper with Planet's technology is profound — spanning multiple sectors and disciplines — and is one of the core superpowers behind broad area management.
Interested in learning how deeper insights can enhance your understanding of activities across the Earth’s surface? Watch our on-demand webinar that showcases how Planet can help your team achieve broad area management, at scale.
Ready to Get Started
Connect with a member of our Sales team. We'll help you find the right products and pricing for your needs.