
Tracking Deforestation
This interview originally appeared in the July 28th edition of Planet Snapshots.
Interview with Matt Finer
For nearly the past decade, Matt Finer has been playing the world’s largest and highest-tech game of whac-a-mole — but with far greater stakes. He’s a Senior Research Specialist at Amazon Conservation and is the director of MAAP (Monitoring of the Amazon Project), a project that leverages remote sensing technologies to monitor the entirety of the Amazon rainforest — which is, if you do the math, ginormous. Since 2015, MAAP has created over 160 reports detailing instances of deforestation and worked with officials to convert these into actionable policy. This week, we spoke with Dr. Finer about how MAAP uses various satellite constellations to discover, evaluate, and monitor deforestation in the Amazon.
* This Zoom interview has been edited for length and clarity.
How does MAAP monitor the entire area of the Amazon?
There’s always two things I’ll talk about throughout this interview: there’s the imagery and then the algorithm to analyze the imagery. Your eyeballs can only look at so many images, right? So you need to automate it a bit. When we started in 2012, the cutting edge technology was 30m resolution and semi-automated alerts. Then came a new program which would automatically generate an alert when there was a difference in a 30m pixel between one pass and another pass over the global tropics. That was a huge gamechanger. So basically we’re able to monitor vast areas such as the full Amazon because of these automated alerts.
How many of those alerts do you get in a week?
Thousands. But we’ve also become skilled in filtering those thousands of alerts and being able to focus in on what we characterize as the most urgent. You can see if it’s just an isolated 30m pixel, if it’s a group of pixels together that are forming an obvious new soy plantation, or if it’s very linear and clearly looks like a road. Then we’ll do a quick filter and see which alerts fall over a protected area or Indigenous territory. That’s our first level quick proxy for illegality.
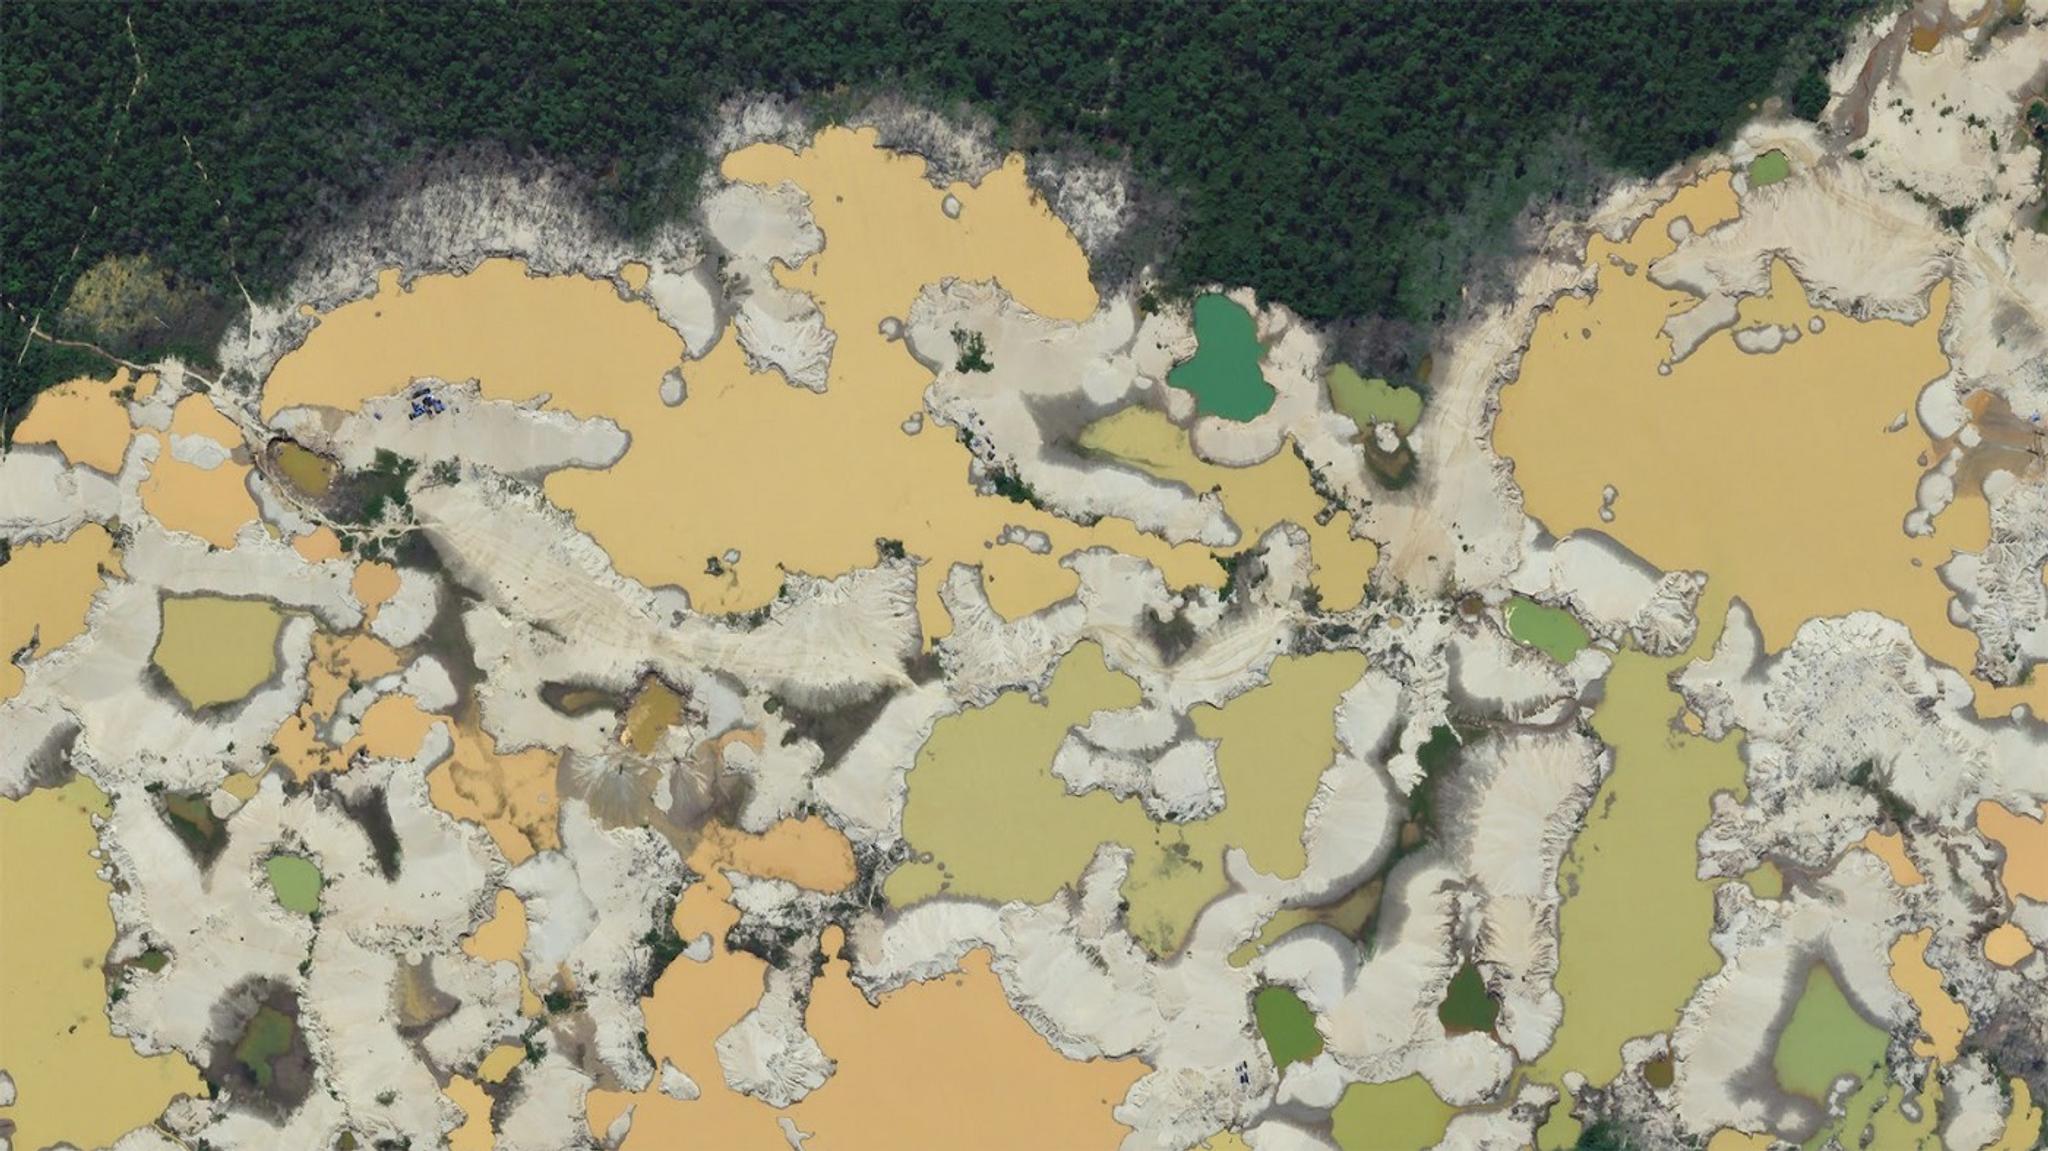
Caption: Recent expansion of gold mining deforestation in the buffer zone of Amarakaeri Communal Reserve (Cusco region). Data: SkySat, Planet
We use the Landsat 30m and Sentinel 10m alerts to go wide, but for any given part of the Amazon we can then go deep. So once we identify a cluster of really concerning alerts, that’s when we go to Planet at 3m. And it’s that jump from 30m to 3m where you can suddenly distinguish a lot. You can very quickly filter out the natural versus human-caused deforestation.
Then for a particular area that’s the most urgent, we’ll task SkySat. With SkySat at 50cm, we can actually identify the mining camps and machinery. You basically have gone from a 30m alert, to 3m confirmation that it’s gold mining, to 50cm actually seeing that there’s 5 mining camps and 20 pieces of equipment. So each level down you’re increasing the actionableness of the information. That’s the big picture methodology in a nutshell.
How does access to a historical data archive aid your investigations?
Even though satellites have been around since the 70s, I argue that they’re still the cutting edge. Some say, “drones are the cutting edge because of the resolution,” but the problem with the drone imagery is it’s just a snapshot in time. One thing I’ve learned doing this a number of years is that a snapshot in time can be misleading. But satellites are creating this archive of the same area over time.
For gold mining, you can do an overflight or a drone and take a picture and be like, see look there’s gold miners working in that area and draw some conclusion about the seriousness of that situation, but it’s the satellites that can tell you whether the miners showed up 2 weeks ago and are clearing a brand new pristine area or if they’re just steadily working an area they’ve been working over the past 15 years. And I’d argue there are very different policy implications for those two different scenarios. It’s only the satellites that give you that context. Put all that together: the imagery, the algorithms for the real-timeness, and then the archive gives that medium to short-term history of what’s happening.
What’s the role of fires in deforestation?
We’re trying to drive home that it’s not like people are going out there and setting the Amazon on fire. If I had a nickel for every time I read something that strongly indicated that, I’d be rich. It’s complex deforestation followed by fire. There’s basically four kinds of fires we’ve pieced together using Planet imagery:
- burning areas recently deforested for soy in May and June
- burning areas cleared for cattle pasture in July
- burning natural savannahs
- cattle and pasture fires that have escaped at peak dry season around September
Satellites really just flag that there’s a fire happening at that moment. But it’s the archive of imagery that’s let us construct those four different fire types. Which brings everything an added level of actionable information.
So you’ve got all this data on a case of illegal deforestation. What happens next?
Take the gold mining deforestation crisis in Peru. We would publish 2–3 reports a year documenting the escalating crisis, but it was during that time that we pioneered a different type of confidential report sent directly to the government. And we really found that was a big breakthrough for us. Because no one likes to look bad publicly — especially without any advanced warning. So we found that it was really effective to directly share this information with the government confidentially, but then have this hook that they know it’s eventually going to go public. So it’s like the carrot and the stick, where together either piece — if it’s just all confidential or all public — doesn’t quite get you there, but it’s that combination that we’ve found to be quite powerful.
What role do you see satellite data playing in the future for deforestation monitoring and enforcement?
It’s the satellites and it’s the algorithms. Just this year two new systems of alerts have come out, including one that is based on radar, which has the advantage of seeing through clouds. In terms of resolution, we’ve gone from 250m to 30m to 10m. So the next big breakthrough will be having near-daily alerts at 3m.
Then there’s the evolution of the imagery itself. Now we’re down to 50cm with SkySat, and we’re really pioneering ways to use that highly actionable information. And then third I would add, is other space-based information. I think we’re going to see more satellite-based carbon or methane information. So there’s tracking the technology to how we can better link deforestation to carbon data.
And to close out, what’s your all-time favorite satellite image?
It changes, because I’m always obsessed with the images in the report that we’re working on at any given time. But I would say this whole report we did on just the beauty of the Amazon, instead of doom and gloom deforestation. We just featured imagery using satellites as art and the beauty of the Amazon.
If you’d like to learn more about Matt Finer’s work, check out his Twitter account. And if you want to stay up to date on MAAP’s investigations, then read all their reports here.
Ready to Get Started
Connect with a member of our Sales team. We'll help you find the right products and pricing for your needs.