
Seeing Signal Through the Noise: Scaling Biophysical Insights for Agriculture
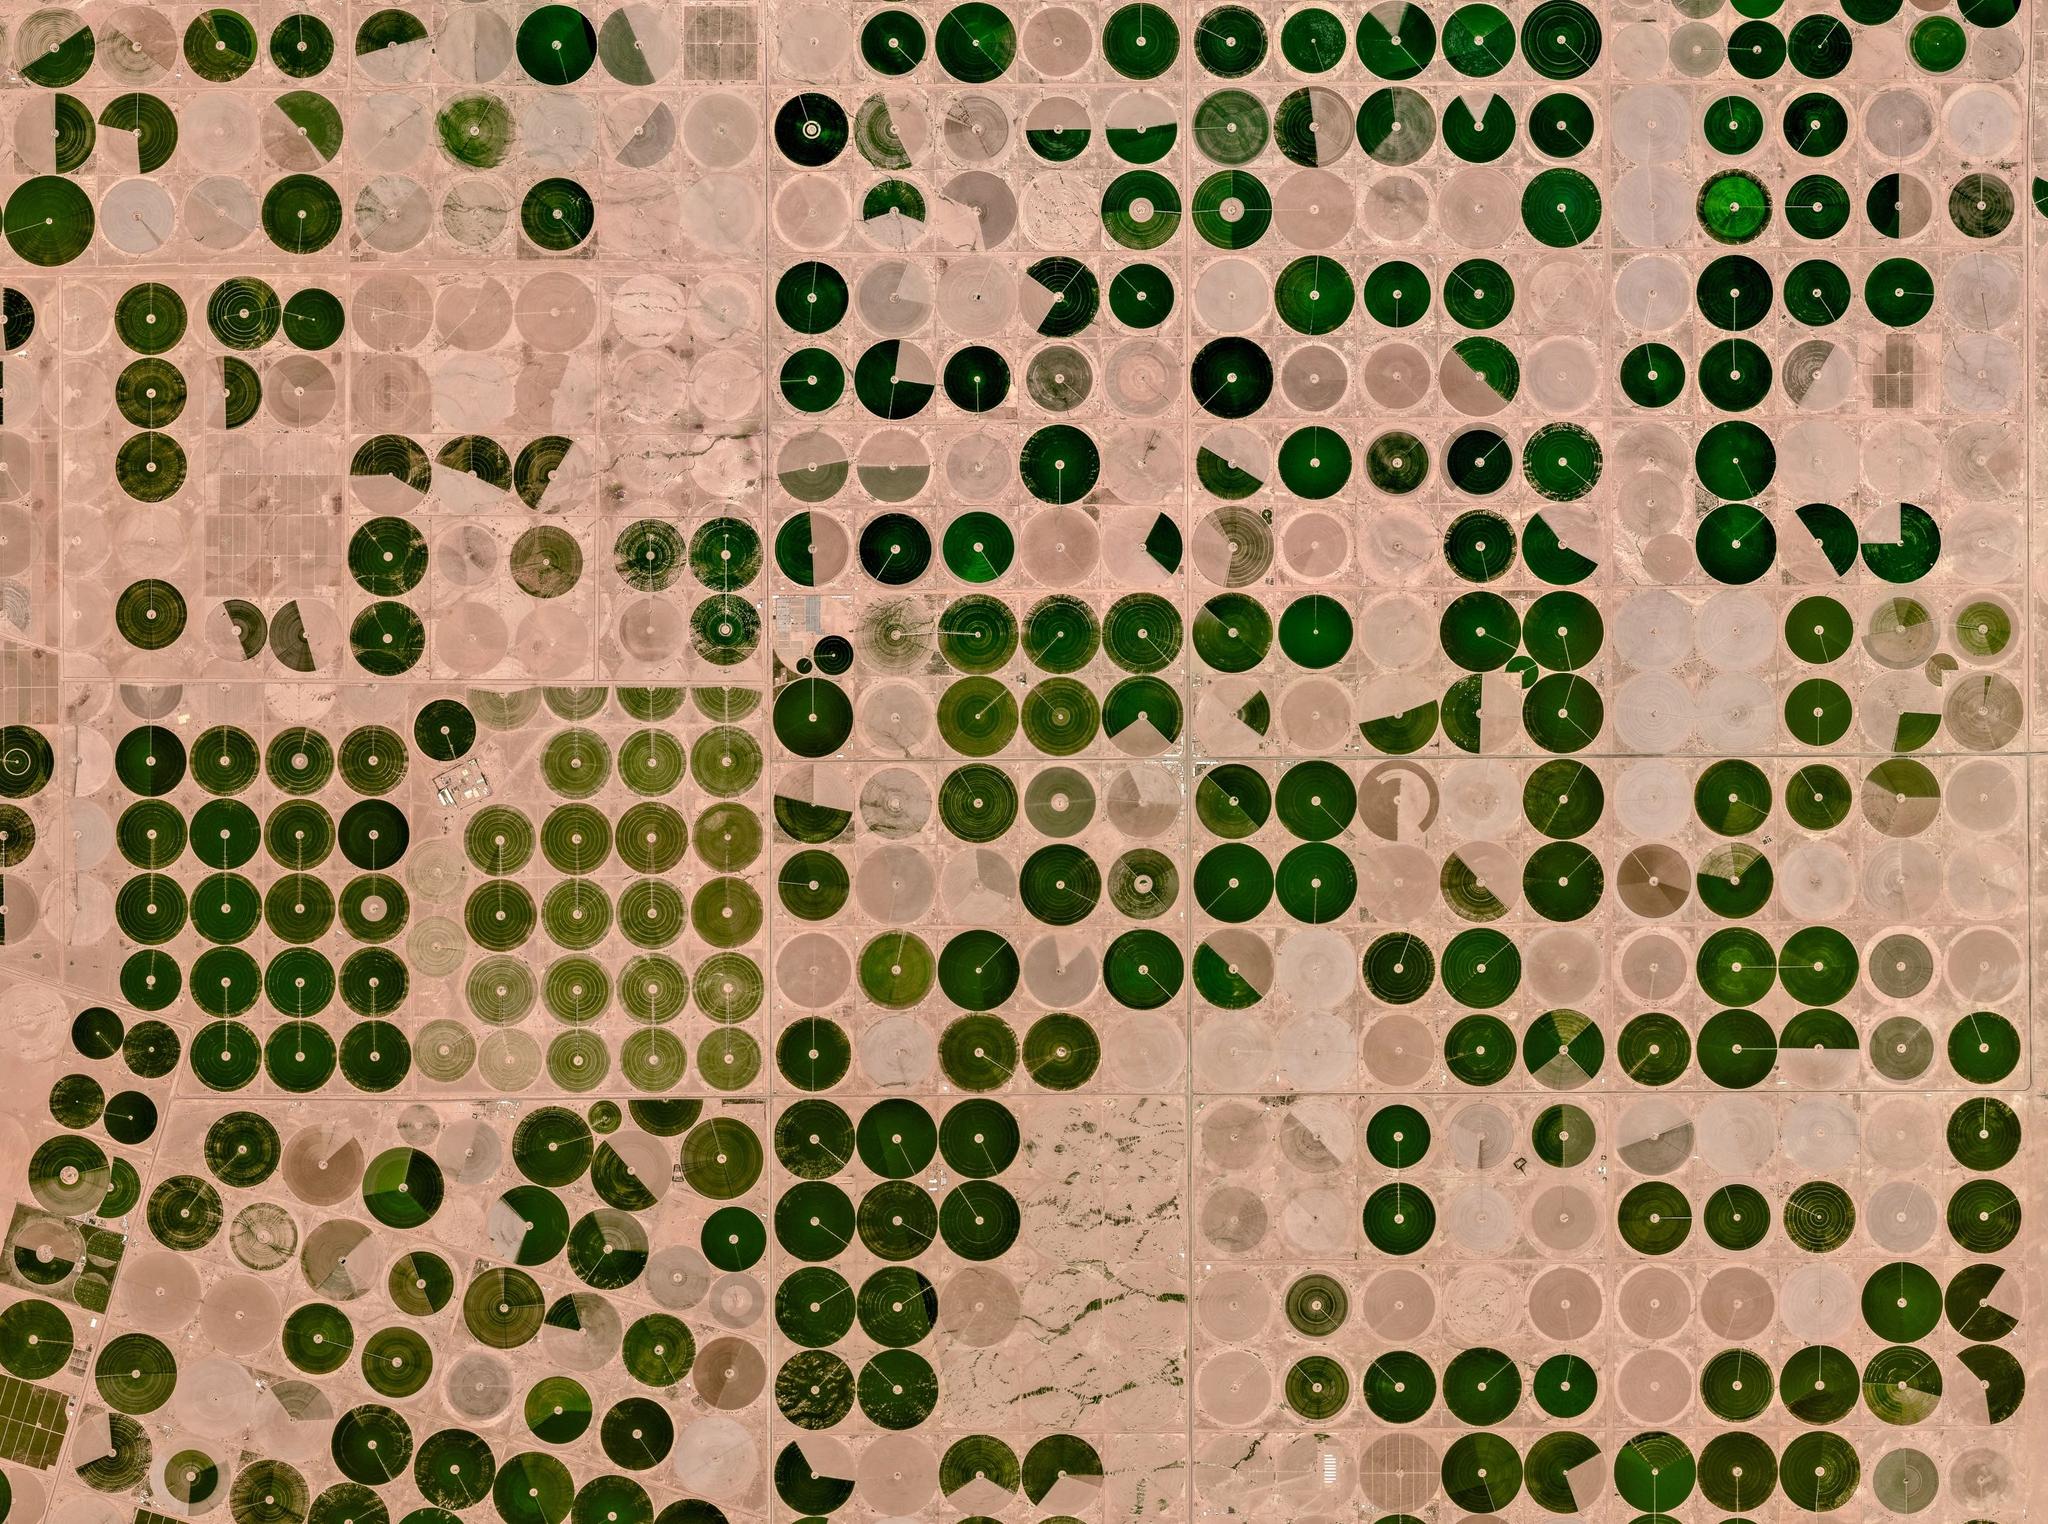
PlanetScope image of center pivot agriculture fields in Wadi-As-Sirhan Basin, Saudi-Arabia, captured March 31, 2025. © Planet Labs 2025. All rights reserved.
TechThis is the second part of our blog series on agricultural time series. In part one, we looked at the foundational workflows for building time series and the infrastructure needed to analyze fields at scale.
As demonstrated in our recent webinar, Seeing Signal Through the Noise: Satellite Data Time Series for Agriculture, standard vegetation indices are often just the starting point for modern agriculture satellite analytics. To gain a deeper understanding of crop structure and function — especially when dealing with dense canopies or heavy cloud cover — agronomists must move from simple spectral proxies to more advanced biophysical and microwave-derived variables.
In this post, we’ll dive into the expert techniques covered in the session, moving beyond NDVI toward variables like Leaf Area Index (LAI) and crop biomass that quantify the actual physiological state of the crop, as well as moving beyond optical imagery into microwave and radar remote sensing. We will also look at how Planet Insights Platform simplifies these complex analytical workflows to help scale insights across millions of hectares.
Beyond Indices: Moving to Biophysical Variables
While standard indices like NDVI are excellent proxies for general health, they can saturate in dense canopies, meaning they stop showing changes even if the plant is still growing. To get a more precise view, agronomic modelers convert these spectral signals into biophysical variables: quantitative measurements that describe the physical structure and physiological function of the plant.
Biophysical variables are crucial to advanced time series analysis because they directly explain crop processes. They include characteristics like:
- Fraction of Absorbed Photosynthetically Active Radiation (fAPAR): Measures how much solar radiation is captured by the crop and is a fundamental input for photosynthesis-based growth models.
- Leaf Area Index (LAI): The ratio of leaf area to ground area, used for quantifying canopy density and water requirements.
- Biomass: Modeled in tons per hectare, this is directly linked to productivity.
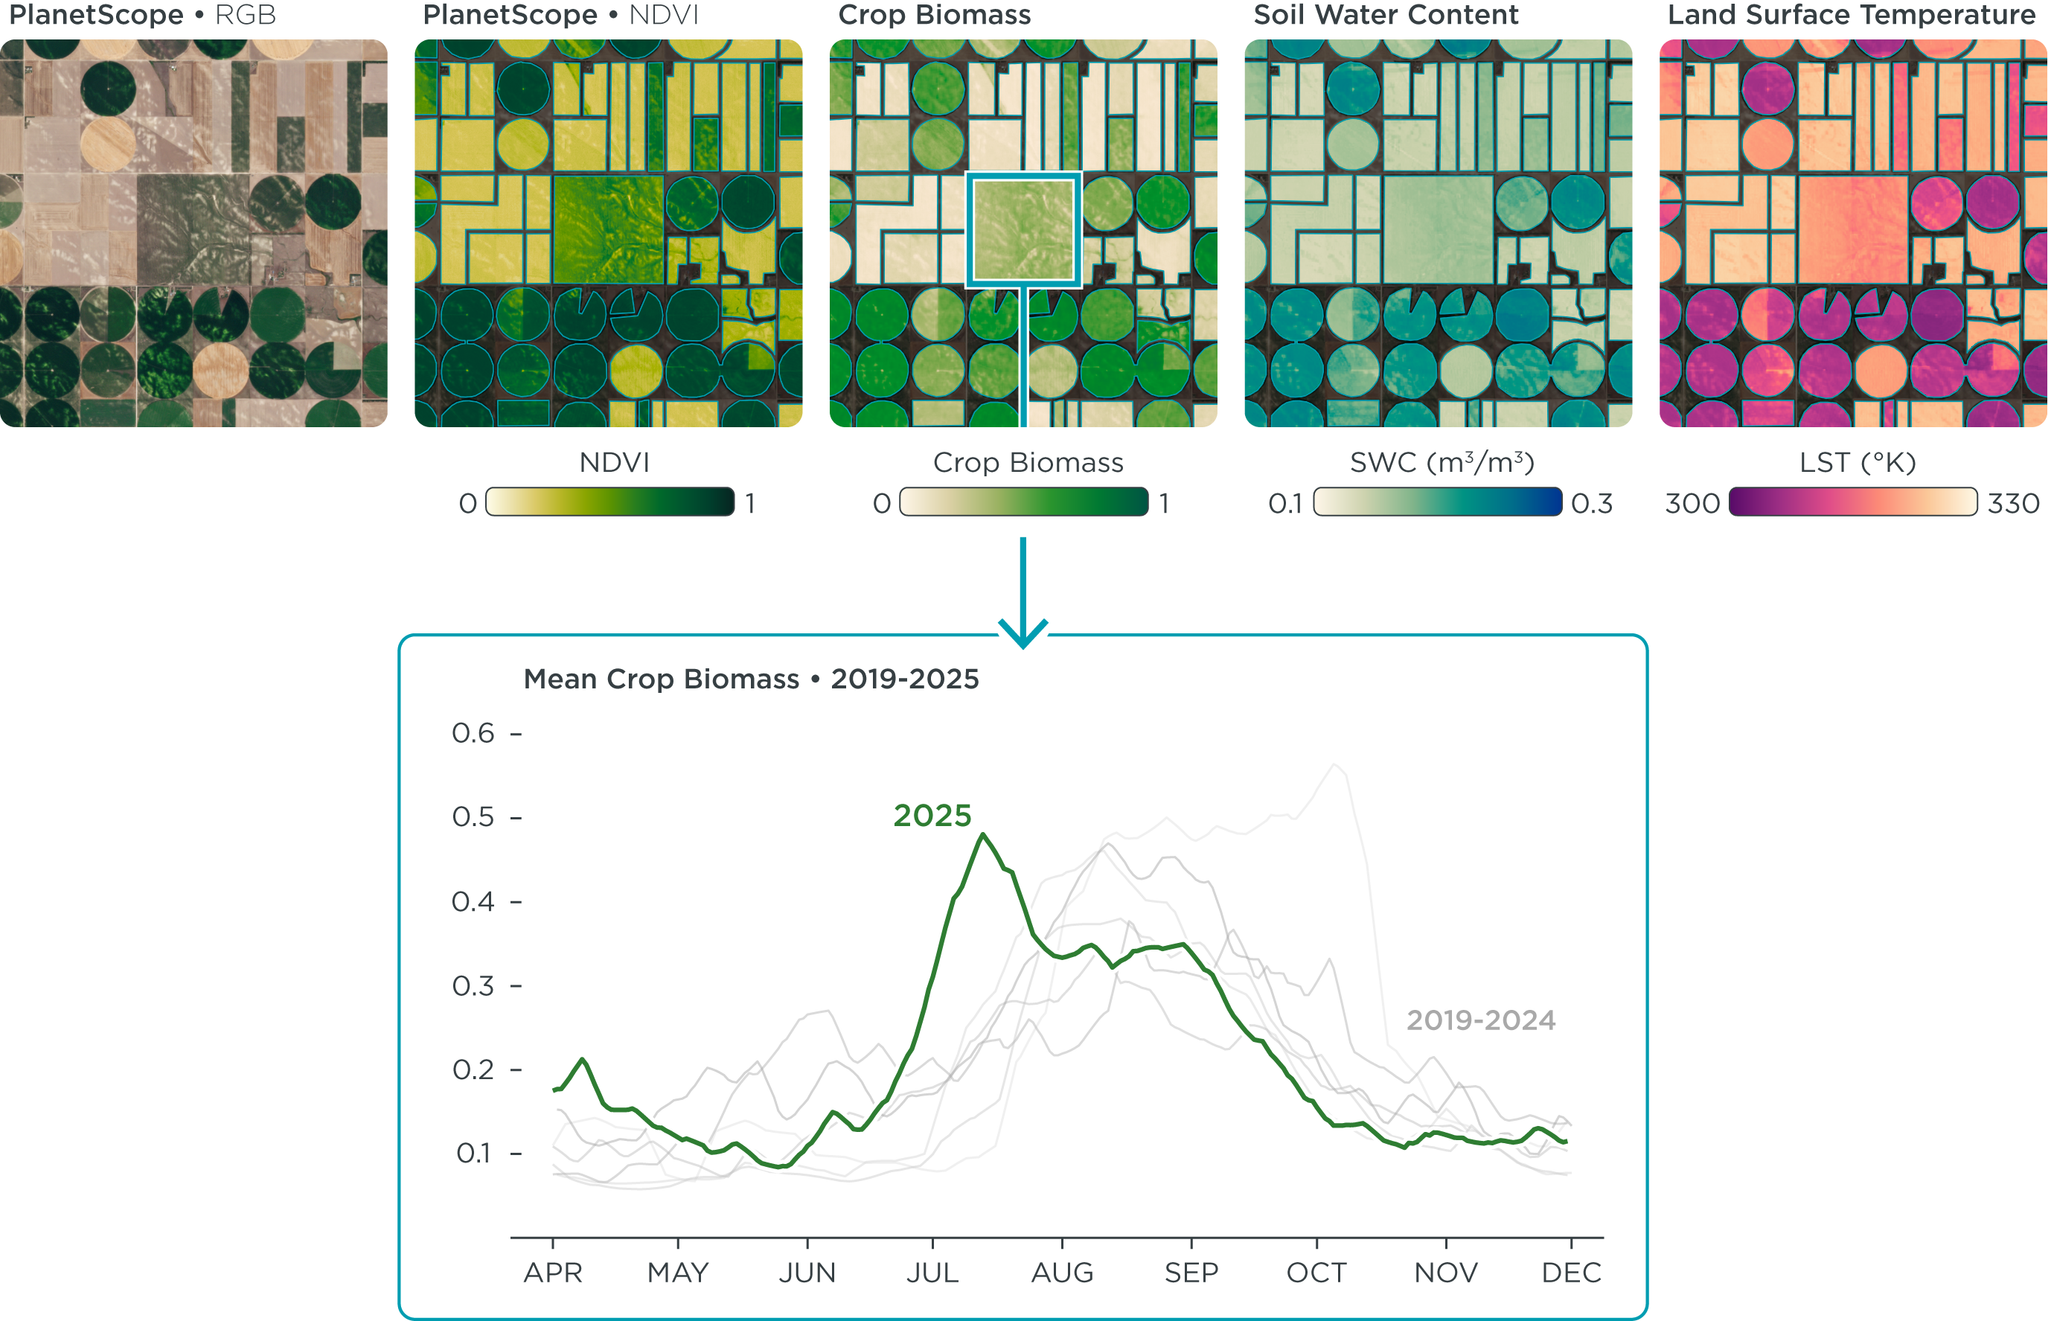
Planet Crop Biomass time series data from 2019 through 2024 plotted year over year for an agriculture field in Nebraska.
The near-daily revisit rate of PlanetScope® data allows remote sensing scientists and agronomists to build consistent, gap-free growth curves that public imagery (with its lower temporal frequency) cannot support. And more images equates to greater confidence in models and earlier insights.
Additionally, for crops with very high biomass, many often switch to more advanced indices like the Wide Dynamic Range Vegetation Index (WDRVI). This index applies a coefficient to the near-infrared (NIR) reflectance that maintains sensitivity and distinguishes variability even in late growth stages where standard NDVI fails.
The ultimate value in applying these techniques for generating biophysical variables is the ability to predict harvest outcomes with greater accuracy. By combining fAPAR time series with solar radiation data and crop-specific radiation use efficiency (RUE) values, cumulative biomass can be estimated. This value is then multiplied by a harvest index to provide field-level, in-season yield estimation, helping to de-risk sourcing and harvest logistics across the supply chain.
Planetary Variables®: Completing the Time Series Picture
For many critical applications, particularly parametric insurance or risk management, time series must be complete and extend beyond optical data to account for cloud cover and environmental stress. Planetary Variables are a suite of analysis-ready data products that combine optical and microwave sources to provide comprehensive temporal coverage — making them an incredibly valuable input for time series analysis.
There are several Planetary Variable datafeeds — each focused on a specific physical property:
- Crop Biomass leverages radar and optical data to deliver a comprehensive view of crop biomass estimations even when cloud cover is persistent. This is the same technology utilized by Disagro® to help rice farmers in Nicaragua identify critical differences in crop development based on water salinity, insights that would have been lost under standard optical cloud cover.
- Soil Water Content measures volumetric soil moisture, providing a valuable indicator for monitoring drought and water stress. It enables irrigation management and drought monitoring at scale with fewer in-situ sensors, and can be useful for parametric insurance models.
- Land Surface Temperature captures twice-daily measurements to reveal the diurnal temperature range, a critical indicator of plant respiration and water stress. This data can be used as an input to estimating Evapotranspiration (ET) and detect early crop stress by identifying "hot spots" where transpiration has slowed. Additionally, the continual time series powers agronomic models for growing degree days and pest and disease pressure.
Together, these Planetary Variables ensure that time series analysis rhas a limited impact from weather or atmospheric conditions, providing the continual, detailed data stream necessary for high-stakes decisions in risk management and precision agriculture.
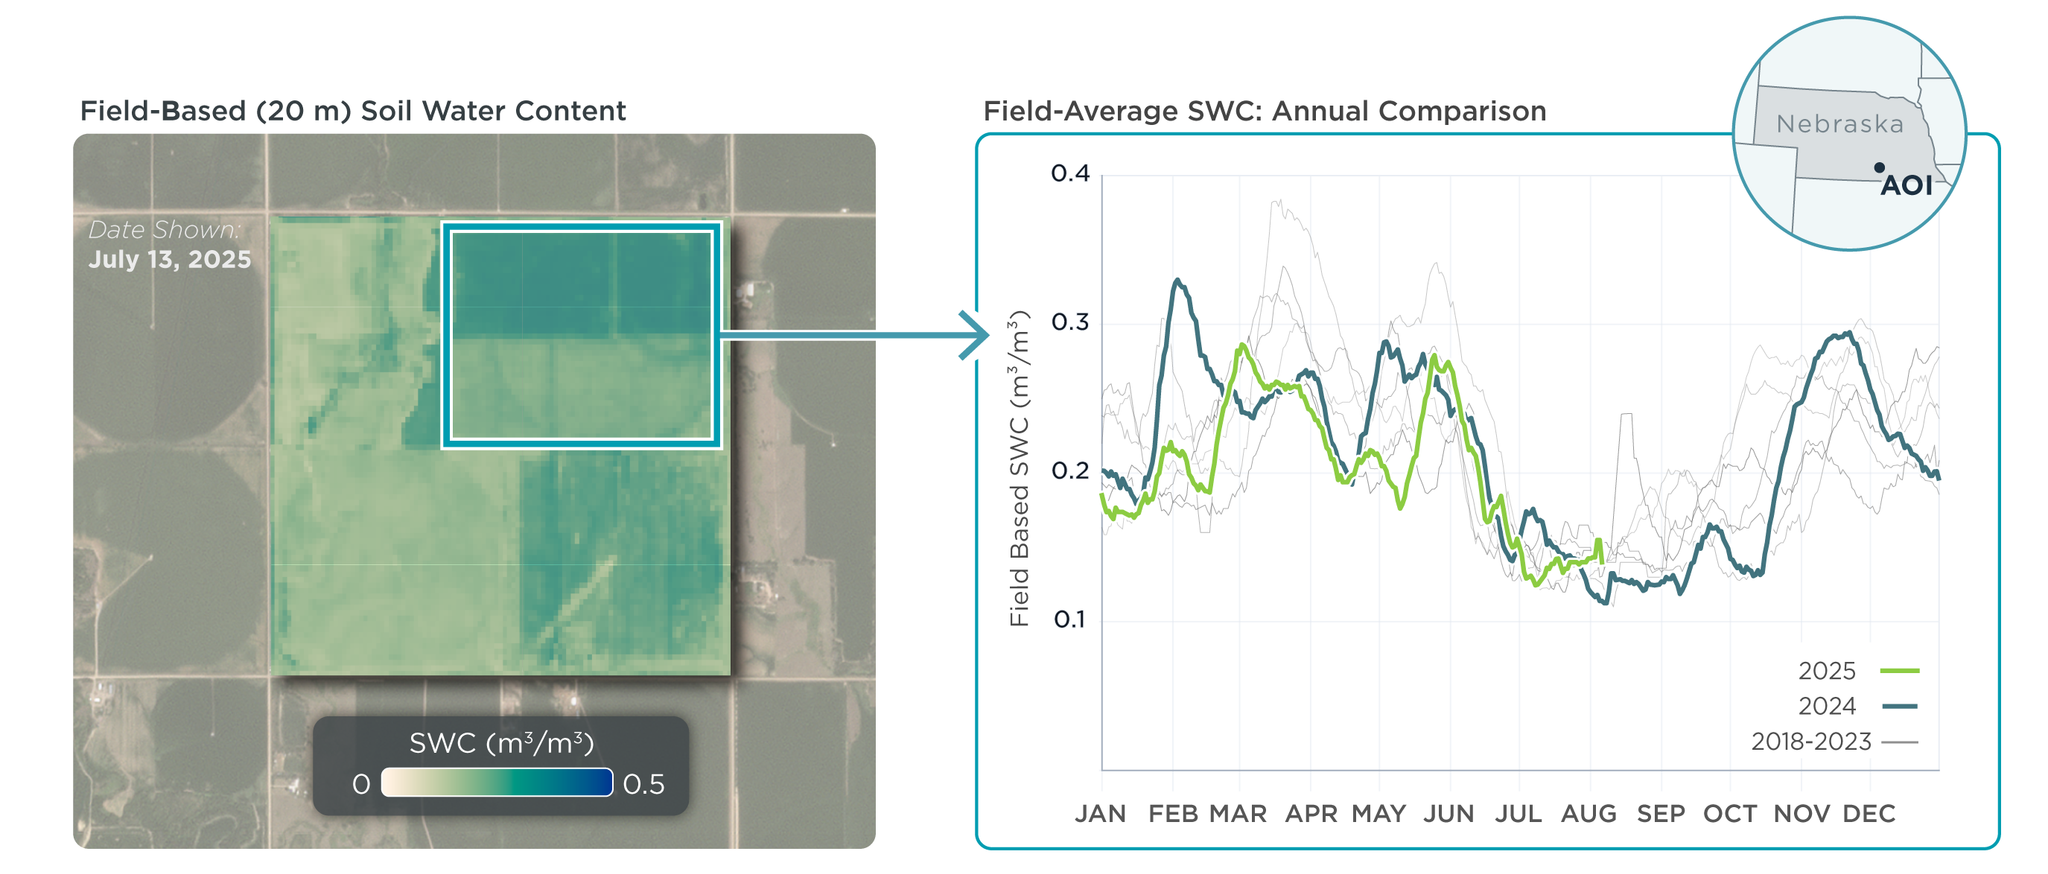
Field-based (20 m resolution) Soil Water Content shows distinct intra-field variation in moisture. The annual time series compares the 2025 field average against historical data (2018-2024), highlighting relative moisture differences that impact plant health.
Get Started with Time Series Analysis
From quantifying plant function to monitoring the environment through persistent clouds, advanced time series analysis provides a multidimensional view of agricultural productivity. By moving beyond simple spectral proxies toward biophysical measurements and fused data streams, teams can uncover the biological "signal" hidden within complex environmental noise.
These high-fidelity insights don't just tell the story of a single field; they provide the information needed to help optimize resources, predict outcomes, and de-risk the future of commercial agriculture at scale.
Watch the webinar recording for a deep dive into the technical details and live demonstrations of these capabilities.
And the same analysis-ready data and cloud-native tools we demo in the webinar are available for you to explore on Planet Insights Platform. Start your free 30-day trial today.
Ready to Get Started
Connect with a member of our Sales team. We'll help you find the right products and pricing for your needs.