
Seeing Signal Through the Noise: Using Satellite Data Time Series for Agriculture
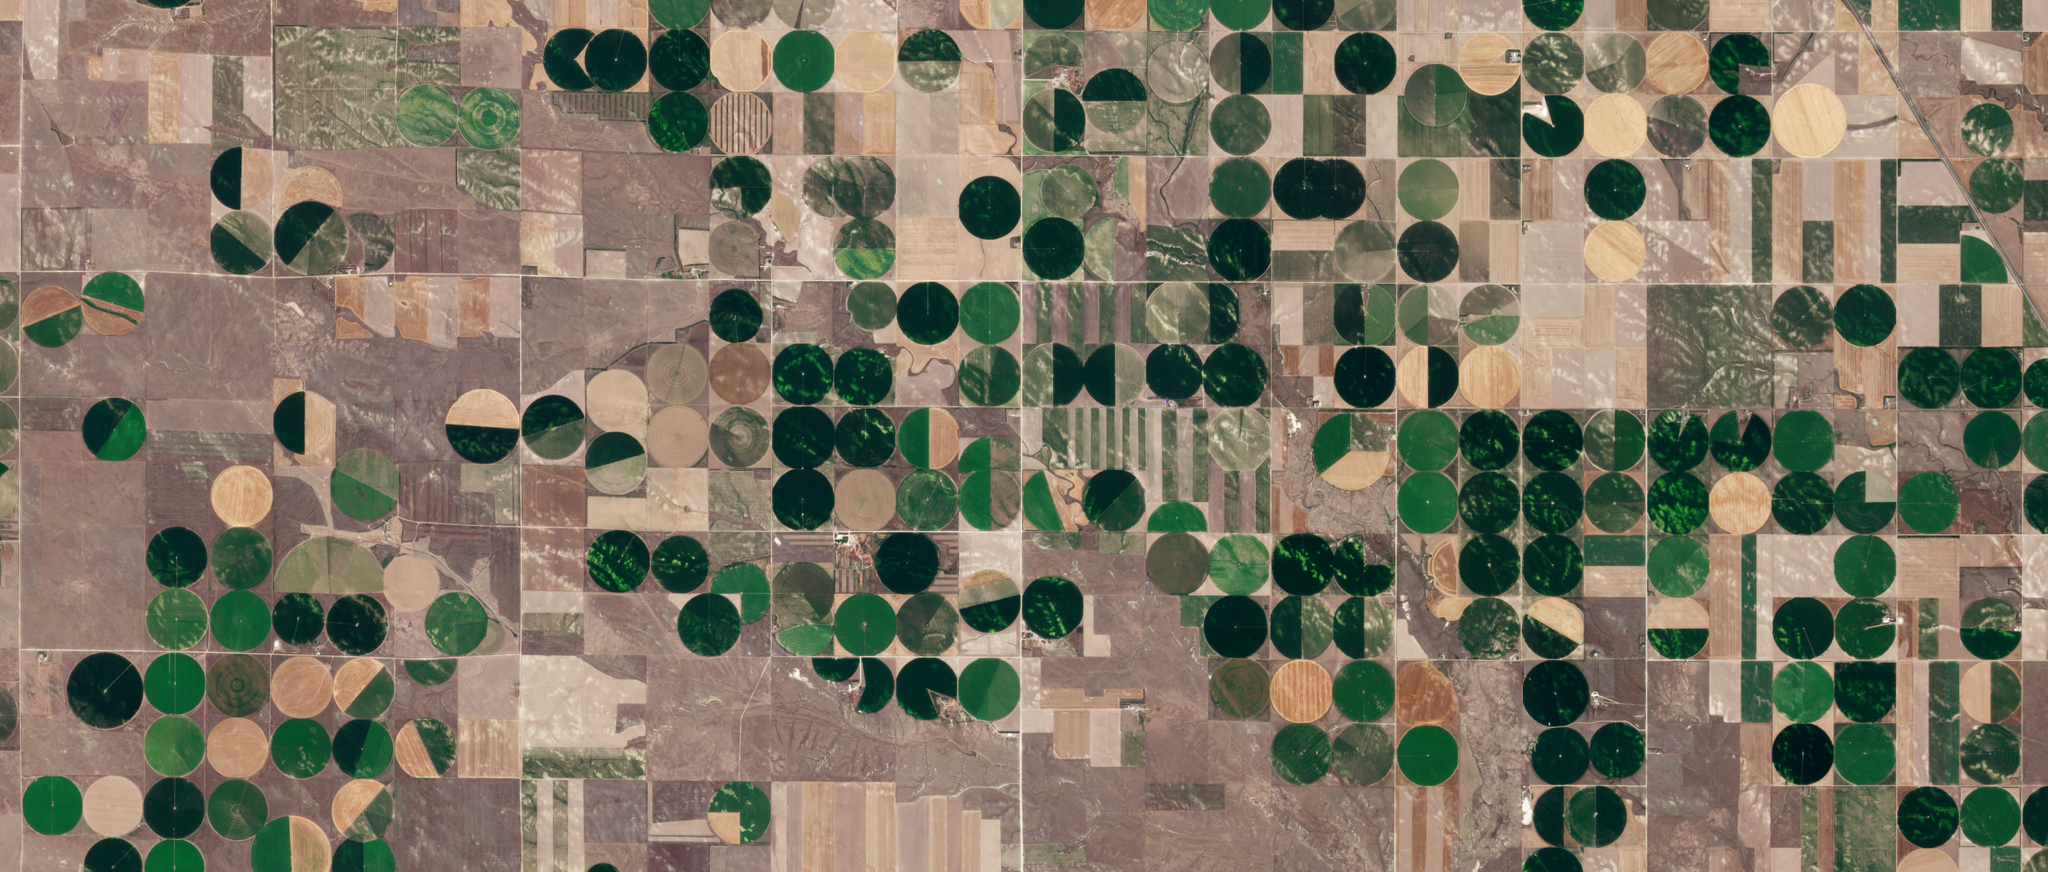
PlanetScope image of agriculture fields in Nebraska, captured July 27, 2024. © Planet Labs 2024. All rights reserved.
TechAgronomics is fundamentally about understanding a temporal process, not a static condition. To truly understand crop dynamics from planting to harvest, agronomists must understand crop trajectory and health throughout the growing season — not just at isolated milestones.
The analysis of time series built with satellite data is a core method for moving past episodic image interpretation. A satellite data time series is a sequence of consistent, high-frequency observations captured over the same location throughout the season. An analysis of this data allows teams to identify meaningful patterns, increase signal reliability, and extract crop insights that result in more accurate decisions and outcomes.
We explored these outcomes in our recent webinar, Seeing Signal Through the Noise: Satellite Data Time Series for Agriculture. Read on to learn more about this technique and how it can be used to transform satellite data into agricultural intelligence.
Outcomes: Greater Certainty, Innovation, and Efficiency
The continual view provided by satellite data time series supports a range of valuable outcomes for agronomists, including:
- Yield Certainty: De-risk sourcing and supply chains with accurate yield forecasts. As traditional county-level reports become less available, Planet partner Barchart uses near-daily satellite updates to deliver detailed, localized yield estimates for corn and soybeans, ensuring agribusinesses have the continual data needed for better risk management.
- Precision Field Scouting: Move from sporadic manual field checks to continuous monitoring of every acre. Planet partner xarvio uses near-daily imagery to automate field prioritization and power variable-rate applications. By identifying crop variability early through regularly available data, teams can make faster in-season adjustments to fertilizer and crop protection.
- Operational Efficiency: Optimize water and labor usage by detecting stress remotely, minimizing input waste. Planet customer Kilimo uses PlanetScope® data in its irrigation management platform to deliver actionable guidance for water-efficient agriculture.
Applications: Benchmarking, Phenology, and Events
A time series transforms static data into continuous and dynamic curves that tell a narrative about the growing season. By analyzing the shape and trajectory of these curves — rather than just individual data points — you can quantify field performance and unlock high-value applications, including:
- Field Performance Benchmarking: Compare a field's current-season performance against its own historical data from previous years or against the performance of neighboring fields planted with the same crop.
- Field Trial Monitoring: Compare different plots or application treatments in a non-destructive way, ensuring continuous, whole-plot measurement without relying on traditional and expensive field sampling.
- Phenology Metrics Extraction: Derive quantitative metrics that describe field performance, such as:
- Area Under the Curve (AUC): The integral of the index values over time, often used as a proxy for productivity.
- Green Up Slope/Brown Down Slope: Measures growth rate at the beginning and dry-down rate at the end of the season.
- Discrete Events Identification: Detect important events or field characteristics in the season, such as planting, harvest, bare soil, tillage, or mowing. Planet Area Monitoring System automates this process with markers that identify events for compliance and verification purposes.
The Workflow: From Images to Time Series
Let’s walk through the process of creating a time series. It begins by mapping precise agriculture field boundaries that exclude non-vegetated land like roads, buildings, and any permanent vegetation. In some cases, a boundary may need to be subdivided into zones, like for field trials or paddocks for managing rotational grazing.
The next step is to procure frequent and detailed imagery. While public imagery sources can provide a valuable foundation, they often lack the frequency needed to build continual time series without large gaps in observations. Planet captures near-daily imagery, which provides more opportunities to capture cloud-free images. This is critical, especially for crops with short growing seasons and in regions with high rates of cloud cover.
The field boundaries and imagery are then used to derive vegetation indices and calculate zonal statistics, such as for the mean index value, within the field boundaries. Plotting these average values across time generates a time series curve.
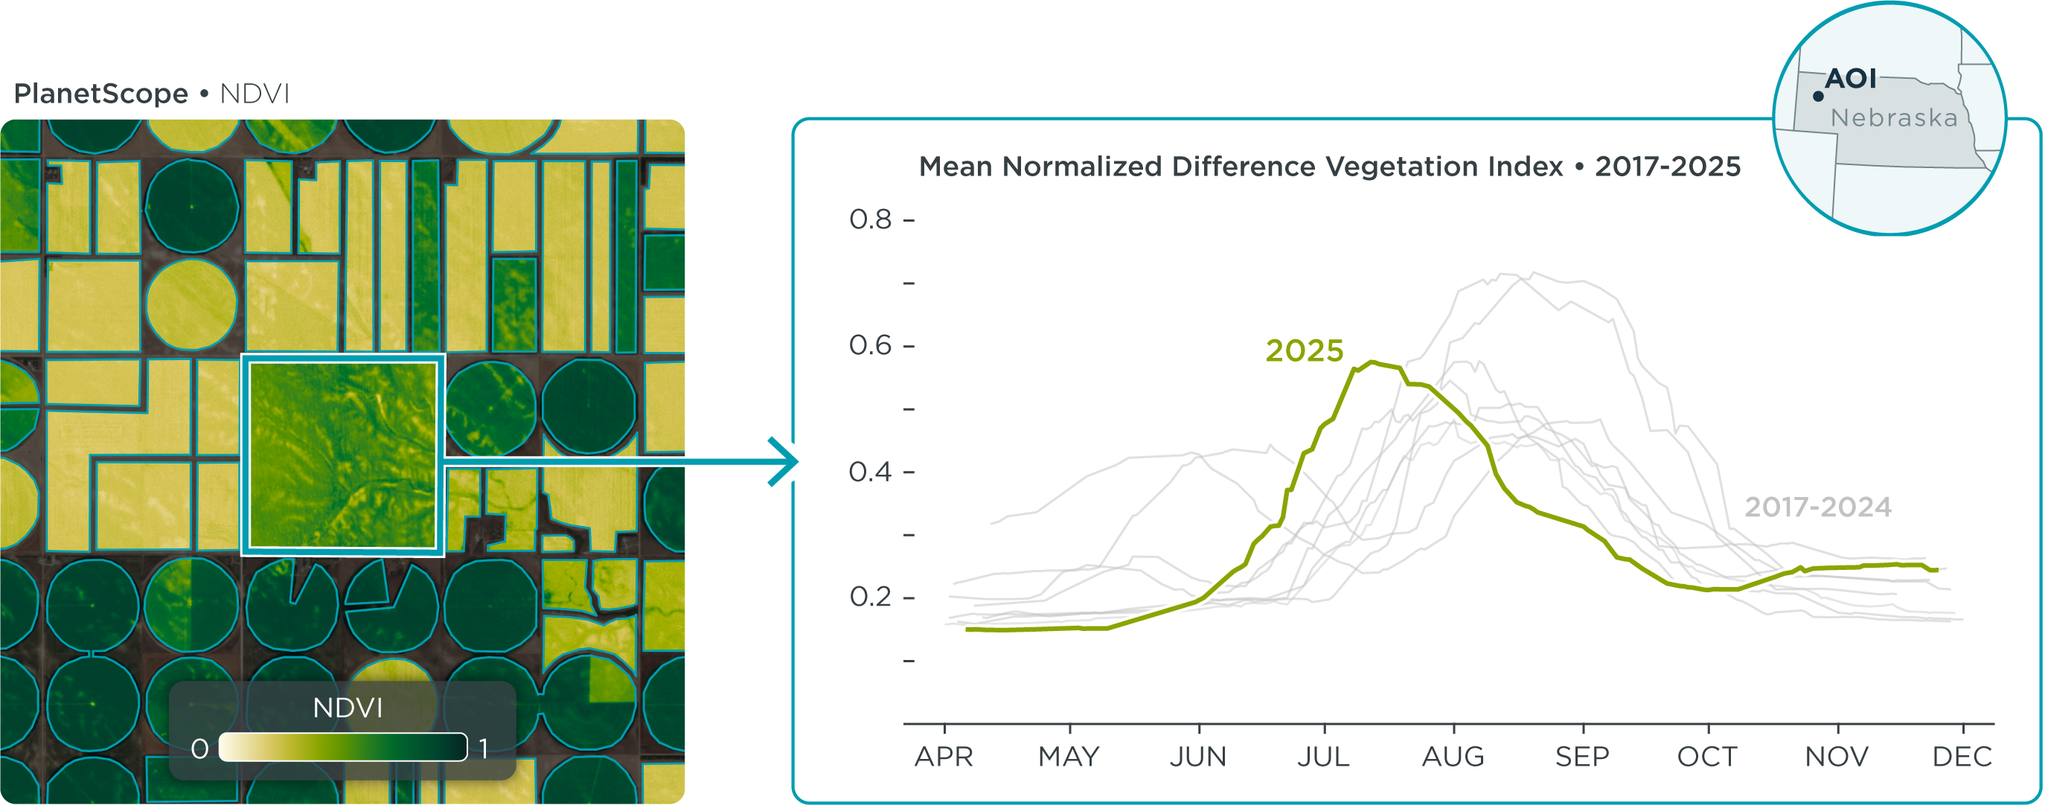
Historical NDVI time series charts plotted year over year for one agriculture field in Nebraska, United States. Data from Analysis-Ready PlanetScope provides time series with high signal-to-noise ratio and minimal data clean up.
There are several vegetation indices to choose from, depending on the information needed. A few common ones are:
- Normalized Difference Vegetation Index (NDVI): The industry standard for tracking general plant health and biomass throughout the season.
- Modified Soil-Adjusted Vegetation Index (MSAVI): Optimized for the early season, this index minimizes soil background noise to track crop emergence and early establishment.
- Normalized Difference Red Edge (NDRE): Leveraging the Red Edge spectral band, NDRE detects variability in dense canopies and late-stage crops where standard NDVI often saturates.
- Enhanced Vegetation Index (EVI): An optimized version of NDVI that corrects for soil background signals and atmospheric influences.
With Planet Insights Platform, you can create your own index calculations using evalscripts to process imagery into time series with cloud-based analysis tools. By processing your imagery into a clean time series, you can successfully isolate the signal” from the noise — providing the data stream needed for the benchmarking and phenology applications discussed above.
Planet Insights Platform: Creating Time Series at Scale
Working with satellite data time series is often bottlenecked by data wrangling. Technical teams face the heavy lift of extensive pre-processing — handling atmospheric correction, geometric rectification, cloud masking, and sensor harmonization — before any agronomic analysis can even begin. And management or analysis of satellite data often involves complex software or standing up significant data infrastructure. These complex requirements often prevent agriculture companies from quickly scaling their solutions.
Planet Insights Platform addresses these challenges by consolidating analysis-ready data and cloud-native tools into a single workflow, allowing teams to focus on agronomy rather than infrastructure. Key features that are especially valuable in time series analysis include:
- Analysis-Ready Data: Analysis-Ready PlanetScope provides harmonized, spatially consistent image stacks by automatically normalizing daily 3 m imagery with public missions like Landsat and Sentinel-2. This eliminates the burden of manual data cleaning and sensor harmonization, delivering a detailed dataset ready for immediate time-series analysis and machine learning.
- Cloud-Native Processing: Data management in the cloud eliminates the friction of downloading large files and allows you to bypass complex operations to move straight to analysis. This serverless architecture helps Planet customers like Abelio scale operations across hundreds of thousands or millions of hectares without the overhead of building and maintaining their own data pipelines.
- Zonal Statistics: Options for large scale batch statistics processing is highly efficient for rapidly extracting the tabular data needed for analysis. It provides the mean, median, or other statistical values of a vegetation index by date for a given field polygon. This makes it easy to feed satellite insights directly into your existing crop models or dashboards.
From Imagery to Insights
By utilizing these high-frequency observations and cloud-native tools, teams can significantly de-risk their agronomic decisions and move past simple image interpretation. However, even with a scalable processing workflow in place, isolating a clear "signal" becomes more challenging as crop canopies thicken and cloud cover persists.
In the second part of this series, we move from the basics of vegetation indices to advanced variables. We’ll explore how to use biophysical variables and microwave-derived data to track crop structure and function through every condition — providing the deeper intelligence needed for complex yield and risk models.
Try Advanced Time Series Analysis for Free
Watch the webinar recording for a deep dive into the technical details and live demonstrations of these capabilities.
And samples of the same analysis-ready data and cloud-native tools we demo in the webinar are available for you to explore on Planet Insights Platform. Start your free 30-day trial today.
Ready to Get Started
Connect with a member of our Sales team. We'll help you find the right products and pricing for your needs.