Triangular Greenness Index Lab
)
As an example of how you can run in-browser analysis on top of our mosaic tile server, today we’re releasing the Triangular Greenness Index (TGI) Lab.
This is admittedly a very non-scientific calculation meant primarily to demonstrate what is possible to do in the browser with (near) immediate feedback from user input. We’re using resampled PNGs from the Color-Balanced Mosaic here, though would be equally feasible to send the client reflectance values per pixel to run the calculation.
In modern browsers, it is possible to do analysis, run transforms, and otherwise mess with raster data just as you might on the server (albeit with tighter memory and processing constraints). Pixel manipulation typically occurs on data that has been resampled from its raw form before being sent to the browser – although it is entirely possible to work with imagery at its native resolution. Working with resampled data can provide a quick way for a user to preview model results or pick parameters that may be used to do image classification or other analytics on the server.
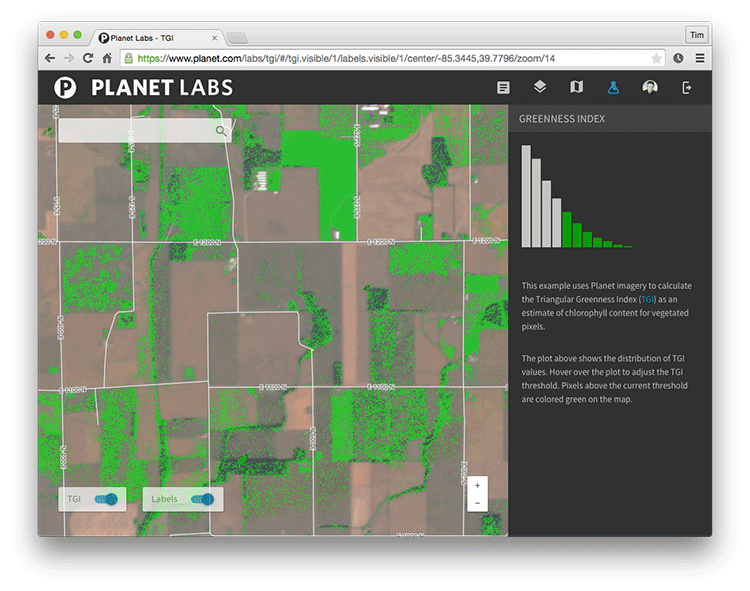
This lab demonstrates how our imagery can be used to generate data about conditions on the ground. TGI is a convenient index because it only relies on reflectance values at visible wavelengths, and is a fairly good proxy for chlorophyll content in areas of high leaf cover, so it can be a useful index for agricultural applications.
The TGI Lab runs a pixel-wise operation on imagery in the browser to generate an estimate of chlorophyll content of vegetated pixels, and enables you to see which parts of the mosaic are above a desired threshold.
If you have a favorite metric calculated off of RGB, let us know!