

What Are the Core Characteristics of Satellite Imagery Resolution?

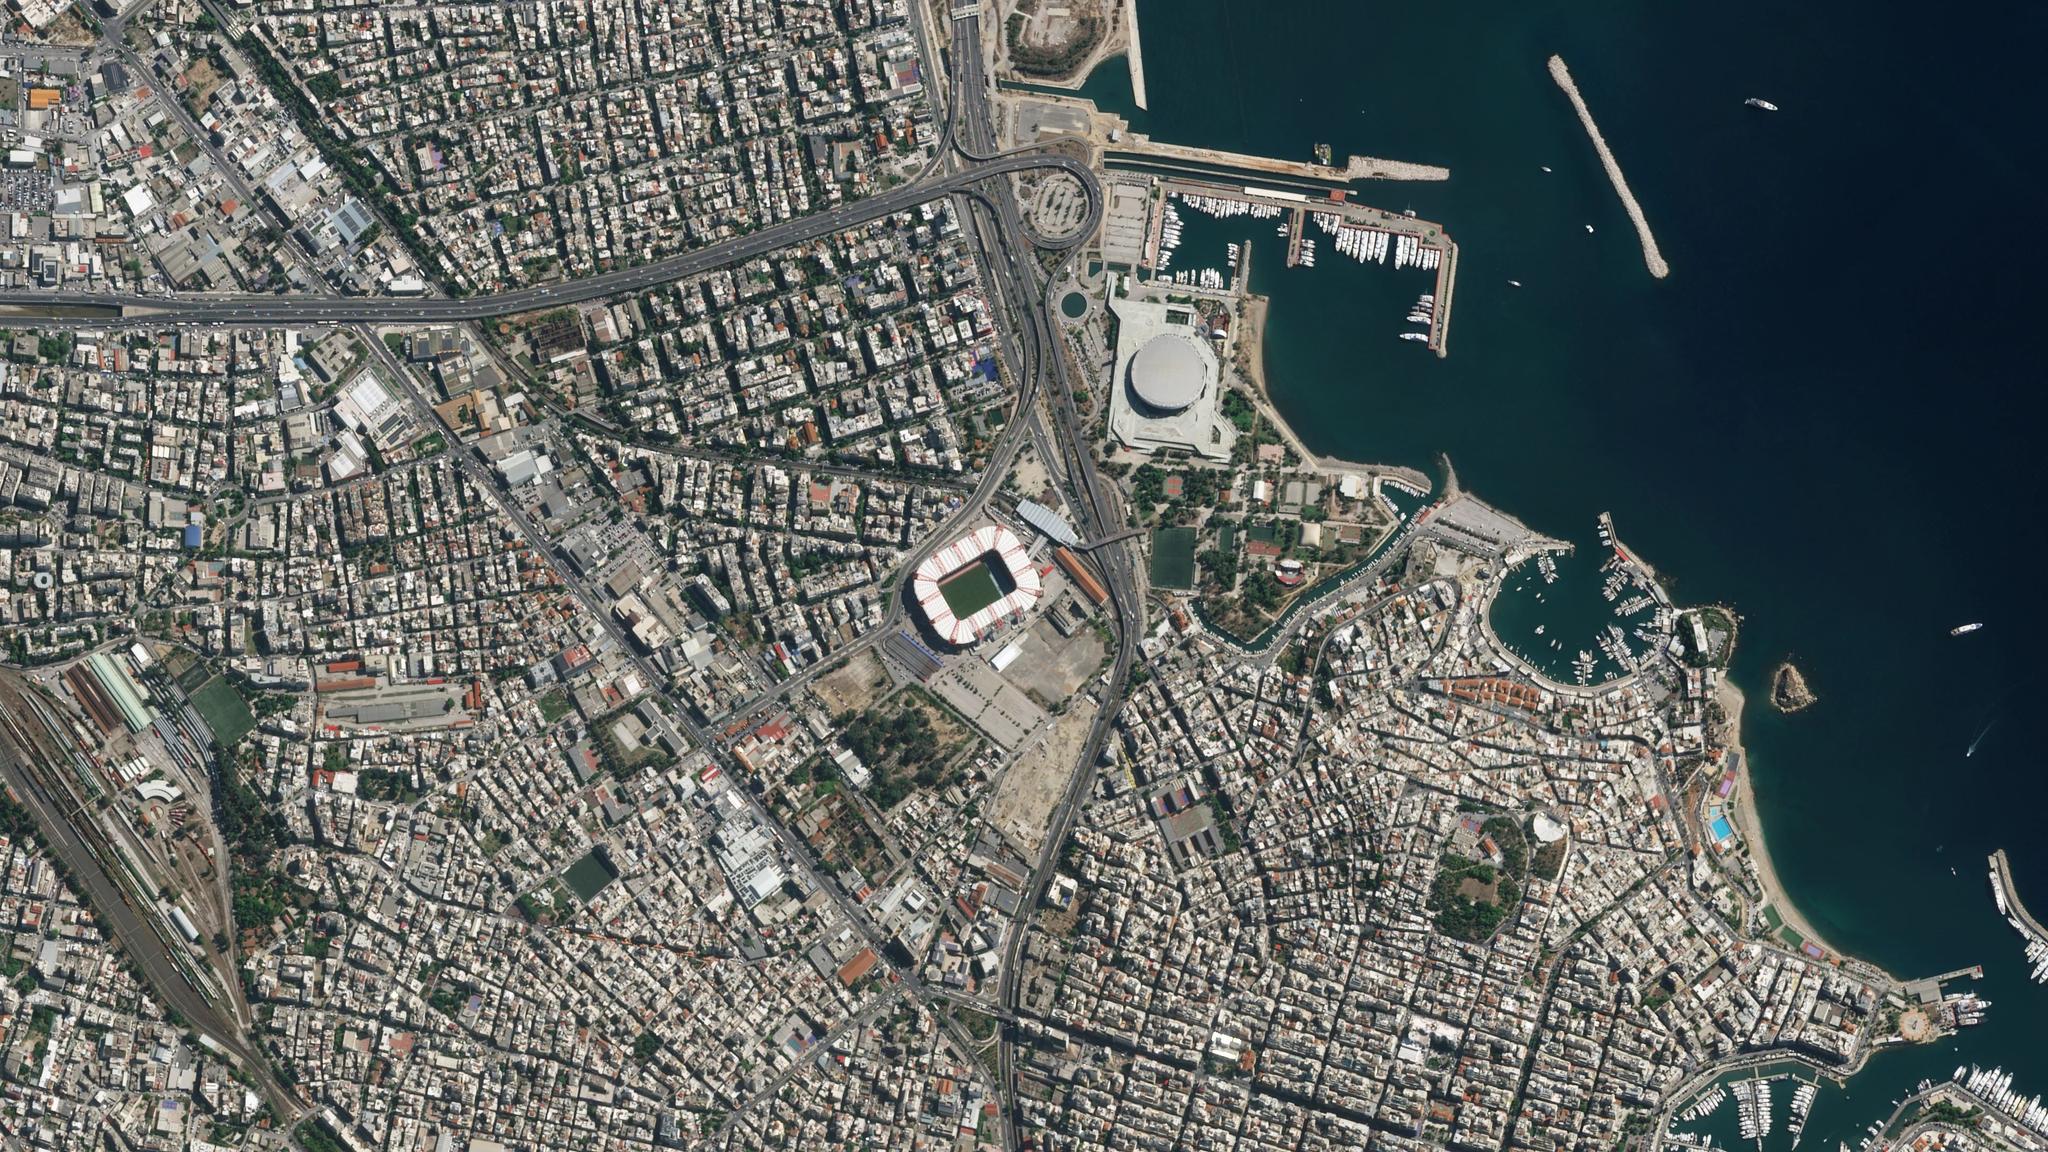
Pelican image of the area round the Karaiskakis Stadium in Athens, Greece, captured November 10, 2025. © 2025 Planet Labs PBC. All Rights Reserved.
EducationWith satellite imagery, there is far more than meets the eye. To the untrained observer, a satellite photo is just a picture of the Earth. But behind every pixel lies a deliberate balancing act of satellite engineering.
When designing and operating an optical constellation, providers must constantly optimize across three core dimensions of resolution:
- Spatial: The surface area that each pixel represents, which determines how sharp details appear.
- Temporal: How often the satellite can return back to an area of interest and capture a new image.
- Spectral: The ability of the sensor to distinguish differences in the electromagnetic spectrum. This can refer to the number and the width of the specific wavelengths the sensor measures.
Currently, no single satellite maximizes all three of these resolutions at once. So when you’re deciding which satellite imagery is best for your use case or analysis, it’s important to understand these technical characteristics, and how they work together.
Spatial Resolution in Satellite Imagery
Spatial resolution is the most common way to describe the level of detail in a satellite image. It refers to the area on the ground represented by a single pixel in a digital image. So if a sensor has a resolution of three meters, it means each pixel covers a three-meter by three-meter square of the Earth’s surface.
And as you would expect, the higher resolution, the greater the detail. High resolution can allow users to distinguish between individual buildings, roads, ships, or vessels. Lower resolution imagery usually appears more blurred, so it’s better suited to observing broad regional patterns rather than specific objects.
This is demonstrated in the images below, which compare an image of Newry, Northern Ireland, from three different satellites. The Sentinel-2 data on the left has the lowest resolution at 10 m per pixel, and is a bit blurry. While the Planet SkySat® image on the right, with the highest, at .5 m per pixel, is the sharpest.
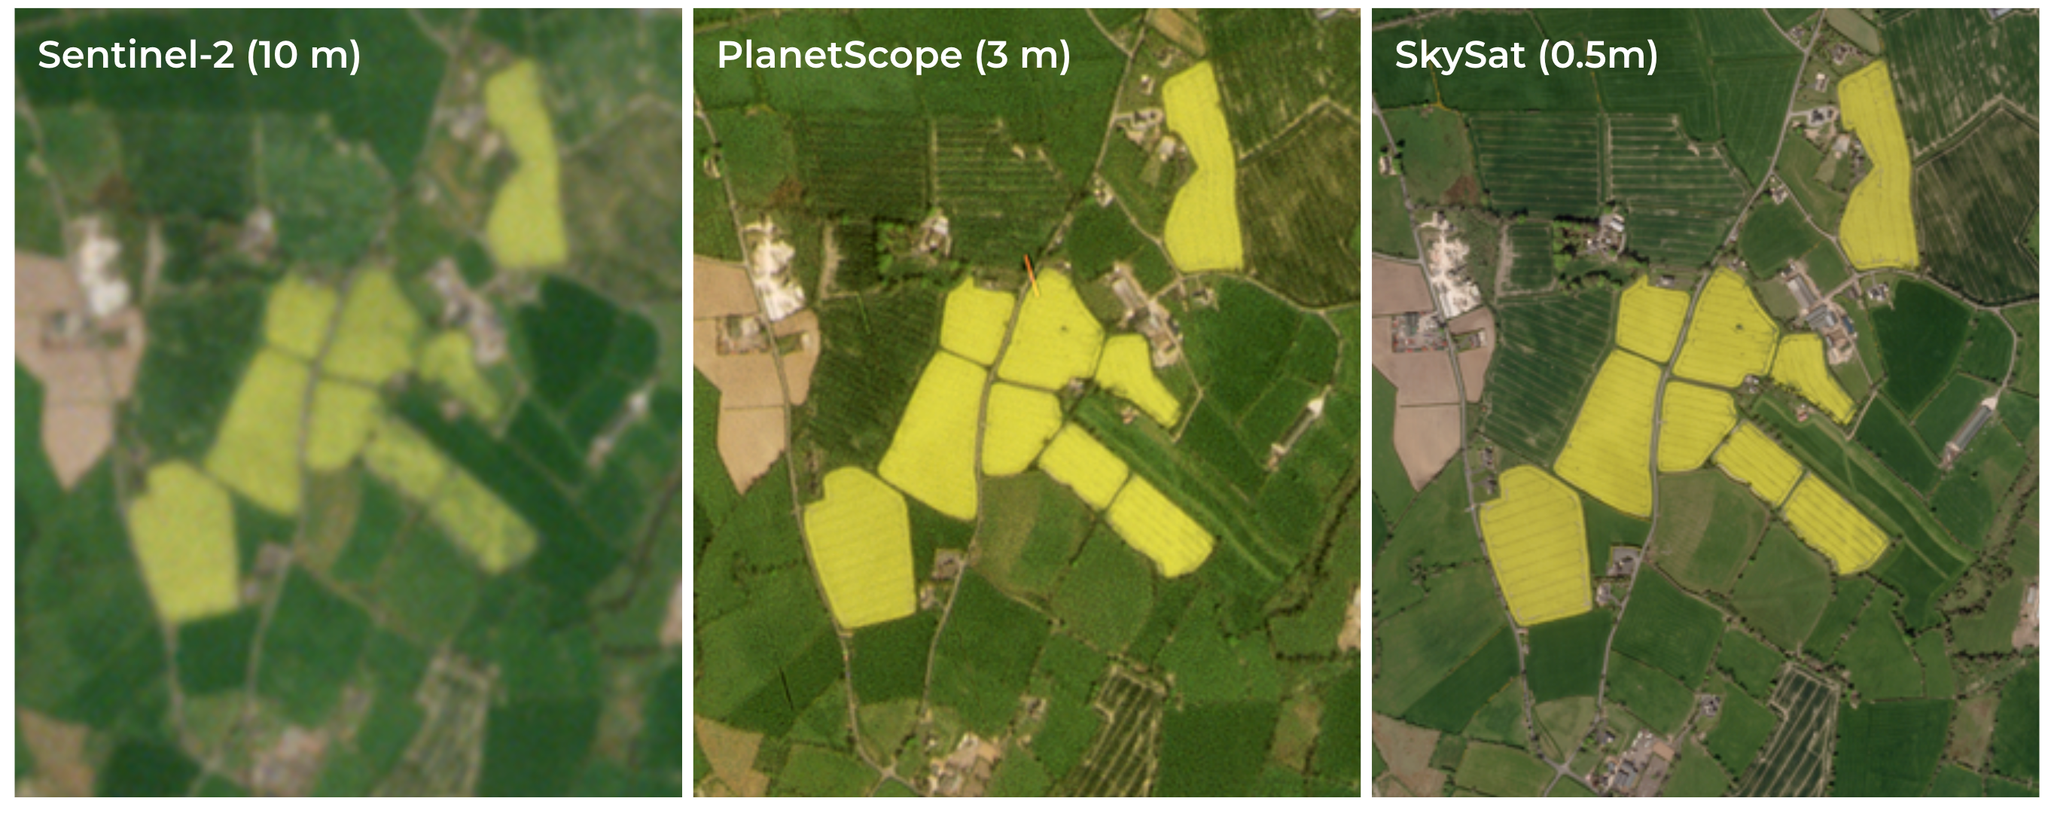
A comparison of spatial resolutions from a public satellite, Sentinel-2, with PlanetScope and SkySat imagery.
While it may seem like a no-brainer to use the highest resolution available for all analyses, there are some trade-offs to consider. High-resolution sensors typically cover smaller areas, demand more storage and processing power to analyze, and can cost more, due to specialized instrumentation. So it really is important to know what resolution is “enough” for your needs.
Temporal Resolution in Satellite Imagery
The temporal resolution, also known as the revisit rate, refers to how frequently a specific area on the Earth is captured. This depends on the number of satellites in a constellation and their orbital paths. A single satellite might pass over the same point every few weeks, while a large fleet of small satellites can provide near-daily coverage of the entire Earth.
The image below compares the temporal resolution of two satellite constellations.
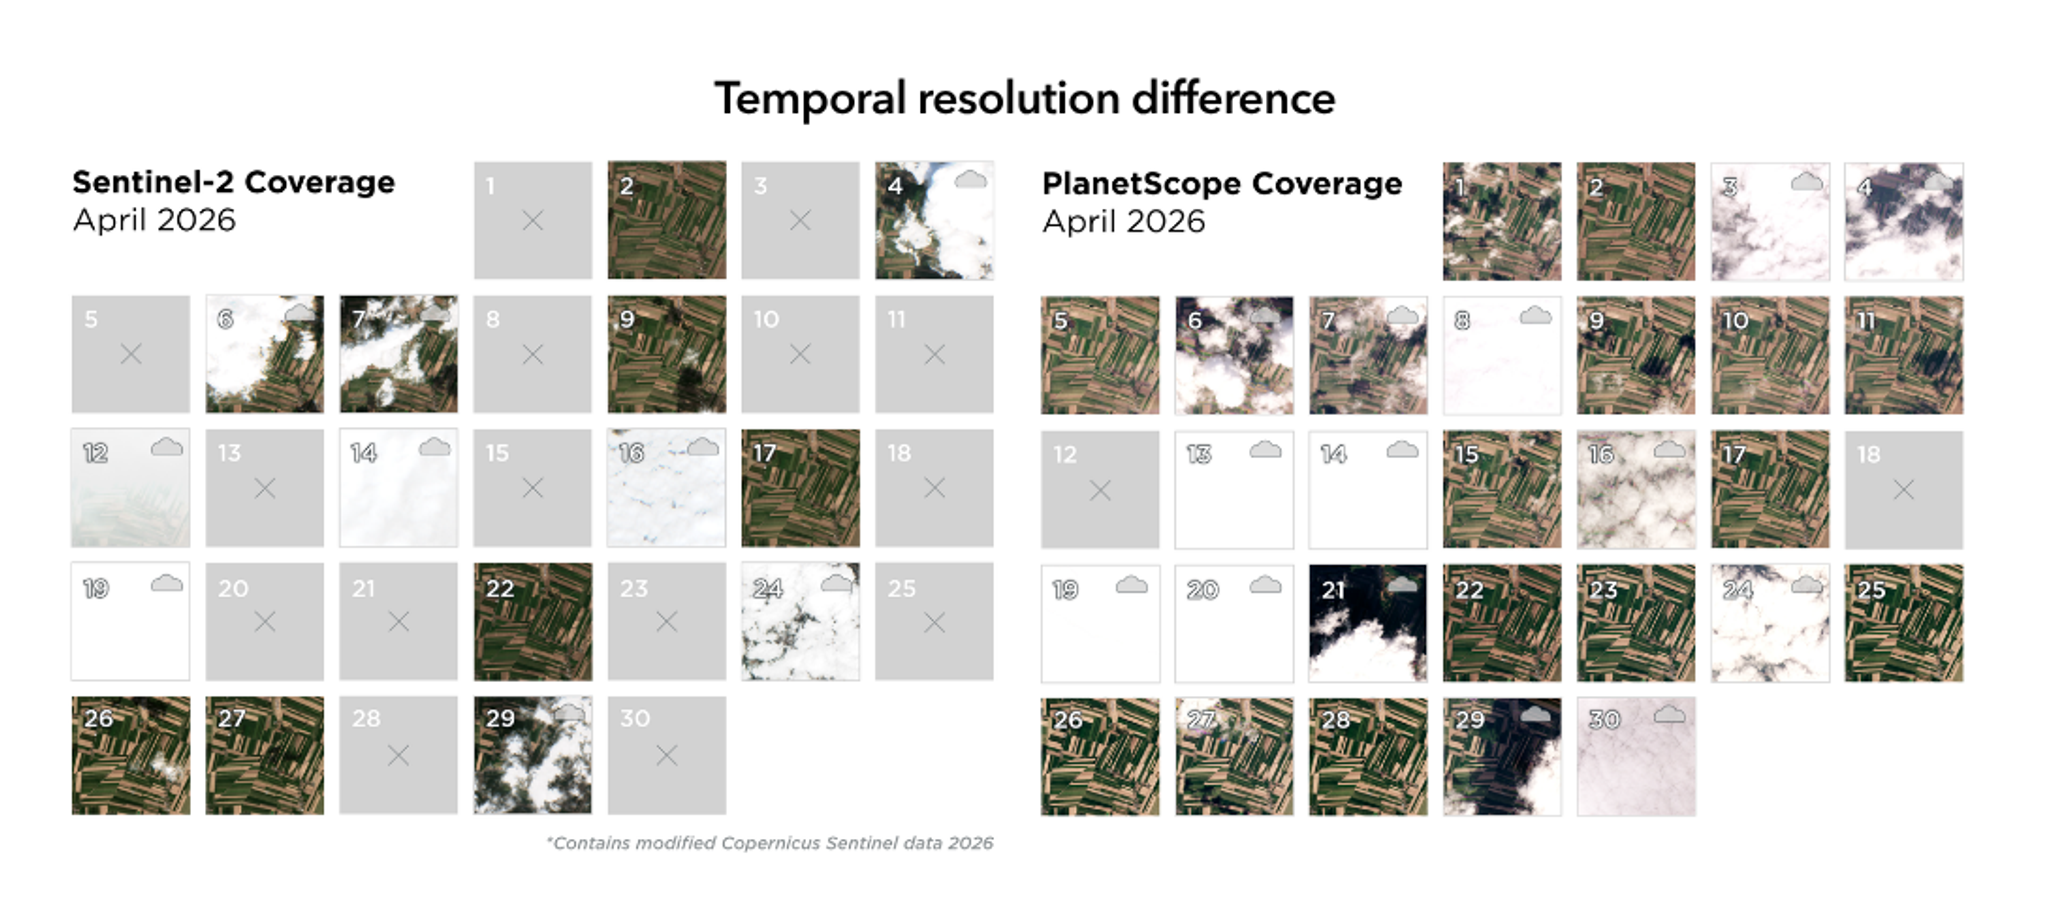
The higher temporal resolution of the PlanetScope constellation allows for greater opportunity to get timely imagery.
A high frequency is critical for tracking fast-moving events like floods, harvests, or construction progress. When multiple sensors work together, they create a continuous stream of information that reduces the gaps between observations. And constant monitoring ensures that change is detected as it happens, rather than weeks after an event has occurred.
Spectral Resolution in Satellite Imagery
Spectral resolution is the ability of satellite sensors to distinguish between different wavelengths, or bands, of light. Common spectral bands used in Earth observation include visible light, near-infrared (NIR), and shortwave infrared (SWIR).
Visible bands capture red, green, and blue light to create images that look familiar to the human eye. Beyond that, NIR light allows satellites to see information beyond the visible spectrum. For example, healthy plants strongly reflect NIR light, much more than visible light. So, multispectral satellite sensors that capture NIR are valuable for tracking vegetation health.
Bands in the SWIR part of the spectrum can detect heat or moisture levels in the soil. And Planet’s Tanager hyperspectral satellite images over 400 spectral bands, allowing for precise measurements of atmospheric emissions, like methane and ammonia. The graphic below shows two methane plumes detected using hyperspectral data from the Planet Tanager-1 satellite.
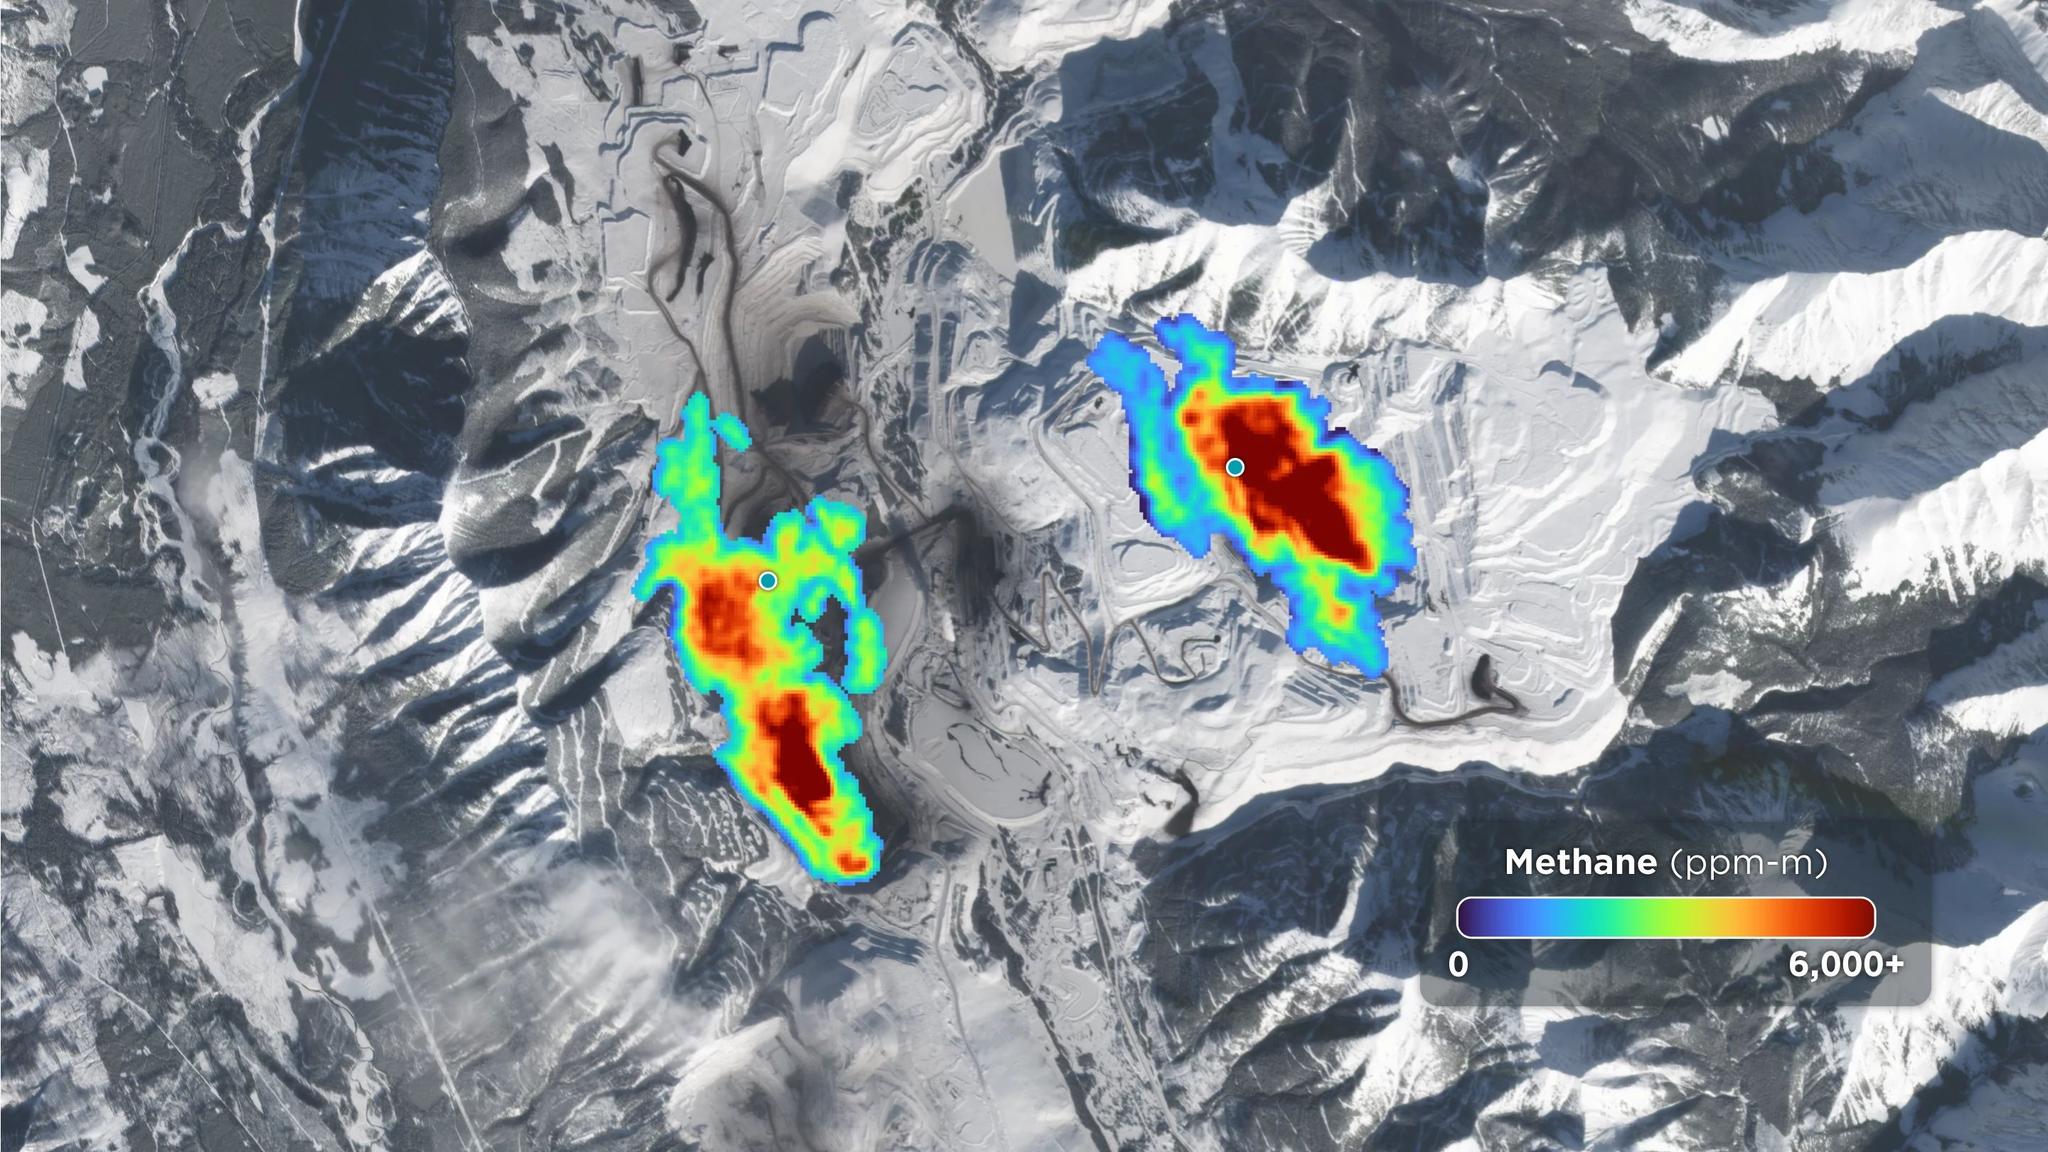
The plumes are in British Columbia, Canada. The Tanager data is from February 15, 2025, and is shown on top of a PlanetScope image from February 6, 2025.
Learn More
You can read more about the specifications and resolutions of Planet satellites on the Planet website. And on the Planet documentation site you can find more specific information and sample datasets that demonstrate the power of each of Planet’s constellations.
In addition, to learn more about satellite imagery, consider visiting Planet University to take the free Introduction to Remote Sensing course.
Questions You Might Have
When referring to spatial resolution, the difference between high- and medium-resolution imagery lies in the area on the ground represented by a single pixel in the image. And generally speaking, a high-resolution image will appear sharper or crisper than a one with a lower resolution.
So, if image A covers 10 square meters in one pixel, and image B covers just 3 square meters, image B would have a higher resolution.
Very often, images of different resolutions are better, together. For example, an analyst might start with a medium-resolution image of a broad area, and if they spot something that warrants a closer look, a high-resolution image of that area is acquired to see things in greater detail. This process is called tip and cue.
Key Takeaway: High-resolution imagery captures a smaller area per pixel than medium-resolution imagery, which generally translates to greater image crispness or clarity.
The quality of satellite data is also influenced by atmospheric conditions, sensor calibration, and the image acquisition angle.
Cloud cover is the most common obstacle, especially in tropical or temperate climates, as it can obscure the ground and make optical imagery difficult to use for consistent monitoring. Atmospheric haze and smoke also scatter light, which can dull the colors and reduce the sharpness of the final product.
Additionally, the position of the sun and the angle of the satellite relative to the Earth can create shadows that hide important features. Consistent processing and calibration are required to correct these variables and ensure the data is accurate for scientific or commercial use.
Key Takeaway: Atmospheric interference, sun angles, and sensor calibration are the main factors that determine the clarity and accuracy of satellite imagery.
Common spectral bands used in Earth observation include visible light, near-infrared, and shortwave infrared.
Visible bands capture red, green, and blue light to create images that look familiar to the human eye. Near-infrared light is especially useful for vegetation monitoring because healthy plants reflect this wavelength strongly, allowing researchers to measure plant vigor from space.
Other bands can detect land surface temperature or moisture levels in the soil, providing data that is not available through traditional photography. By combining these different bands, analysts can create composite images that highlight specific environmental or industrial features.
Key Takeaway: Spectral bands like near-infrared allow satellites to see information beyond the visible spectrum, such as plant health and moisture levels.
Monitoring the global landmass often involves a combination of resolutions to balance detail with geographic coverage. For general environmental tracking, such as monitoring the Amazon rainforest or global ice sheets, spatial resolutions of three to five meters, like PlanetScope, are frequently utilized. However, for active monitoring of agricultural activity and commercial assets, resolutions between three and five meters have become the modern standard.
And when even more detail is needed, perhaps to identify vessels in a port or aircraft in an airport, very high-resolution imagery at 50 cm is used. Organizations often use the broader medium-resolution data to identify areas of interest before zooming in with higher-resolution imagery for a closer look. This process is called tip and cue.
Key Takeaway: Global land monitoring typically uses medium resolution of three to five meters for broad areas.

Ready to Get Started
Connect with a member of our Sales team. We'll help you find the right products and pricing for your needs.