
Continental Crop Type Mapping Leveraging AI, Open Datasets and Planet’s Infrastructure
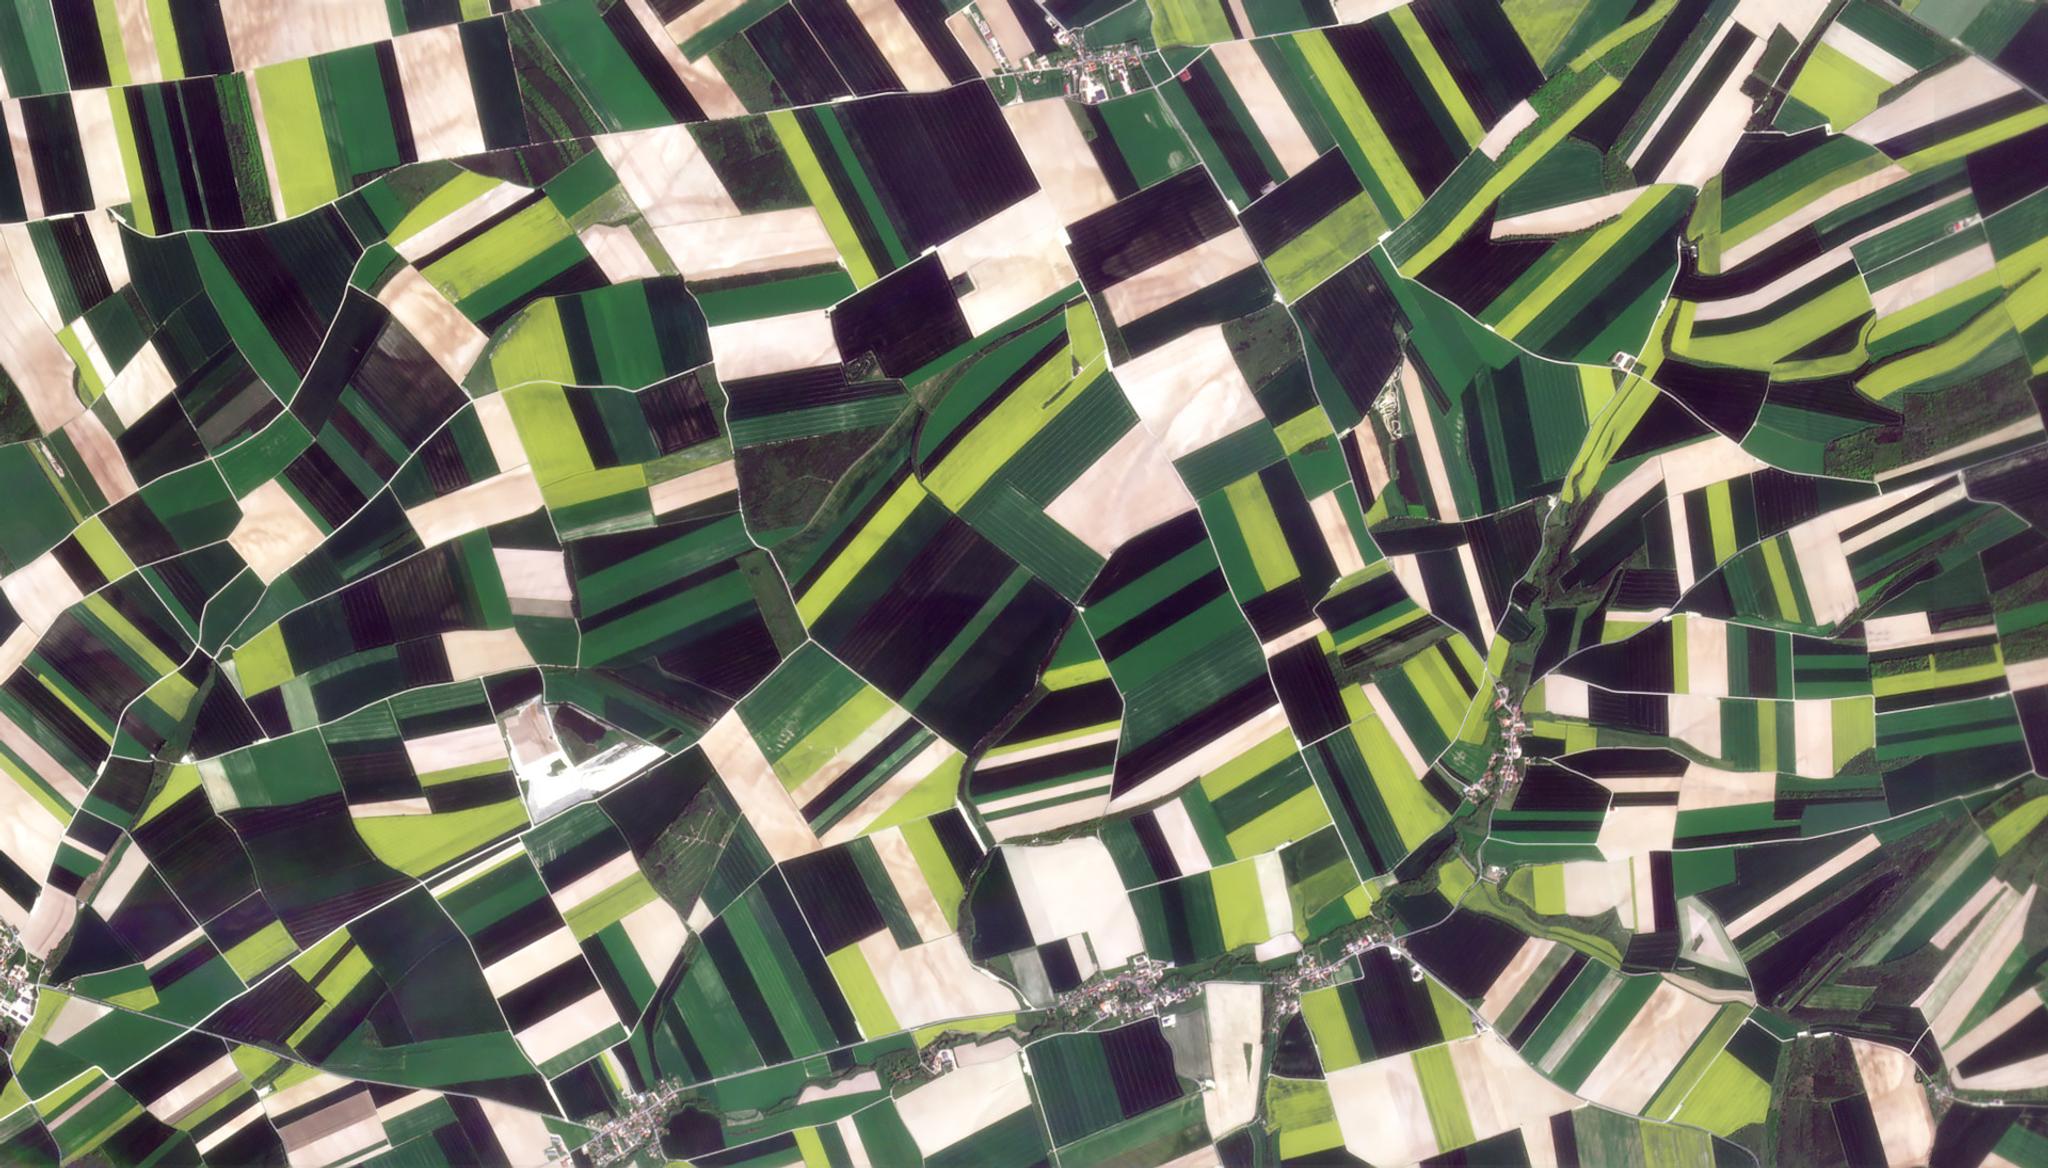
PlanetScope image of agricultural fields in France taken May 4, 2023. © 2023, Planet Labs PBC. All Rights Reserved.
TechIntroduction
By: Caglar Senaras, Nejc Vesel, & Annett Wania
Imagine trying to keep track of every single parcel growing across an entire continent. With the help of satellites and some clever technology, we’re trying to do just that. Earth observation (EO) data, such as satellite imagery, has revolutionized agriculture by providing farmers and researchers with unparalleled insights that can be observed over large areas. Building upon our success in accurately detecting field boundaries with the technology of our Planetary Variable Field Boundaries, as detailed in our previous blog post, we now focus on crop classification. For many agricultural applications, identifying the specific crop grown within each field is crucial. Knowing the crop type allows users to move forward with essential tasks like estimating yield, tracking crop growth stages (phenology), and optimizing agricultural practices. This knowledge empowers farmers and agricultural decision-makers to make more informed choices and improve overall agricultural productivity which is vital for ensuring people have enough food to eat.
Generating accurate crop maps presents significant challenges. In many regions where crop type reporting is not mandated by regulations, obtaining historical crop data can be extremely difficult. This lack of reliable historical information hinders the development and training of robust crop classification models. Without access to past growing seasons, it becomes difficult to account for variations in weather patterns, planting schedules, and crop rotations, leading to reduced model accuracy and limited applicability in new years and locations. Therefore, developing solutions that can classify crops in unseen years and locations is crucial for expanding the applicability and impact of crop classification technologies globally.
Open Earth Monitor Project - the Framework
We recently had the opportunity to explore the development of such a solution under the Open Earth Monitor Cyberinfrastructure (OEMC) project, a collaborative research project which receives funding from the European Union's Horizon Europe research and innovation programme under grant agreement No. 101059548. OEMC aims to enhance Europe's capacity to generate timely, accurate, and user-friendly environmental information derived from EO data. By developing a FAIR-compliant (Findable, Accessible, Interoperable, Reusable) cyberinfrastructure, the project seeks to accelerate the uptake of environmental information and foster resilient user communities.
As part of the activity which aims to develop a European crop monitor, we worked towards producing a continental crop-type map for the 51 million field boundaries described in the recent field boundaries blog. Similar to field boundaries, in this specific task, we have used Sentinel-2 imagery because of its open, high-quality multispectral imagery. The frequent revisit times of Sentinel-2 over Europe and its moderate spatial resolution makes it a great dataset for large scale agricultural monitoring and decision-making.
How We Did It
Sentinel-2 acquires an immense amount of data over Europe each year. All of it has to be processed in order to obtain the time series for each of the 51 million field boundaries.
Creating a European continent scale crop classification thus requires robust scalable infrastructure. We used processing capabilities of the Planet Insights Platform, to extract the yearly time series of the field boundaries. Using Batch Statistical API and Planet Area Monitoring, all the processing of the satellite imagery was done on the platform, which spared us the arduous task of processing petabytes of satellite images and allowed us to focus on the modelling part with the obtained time series.
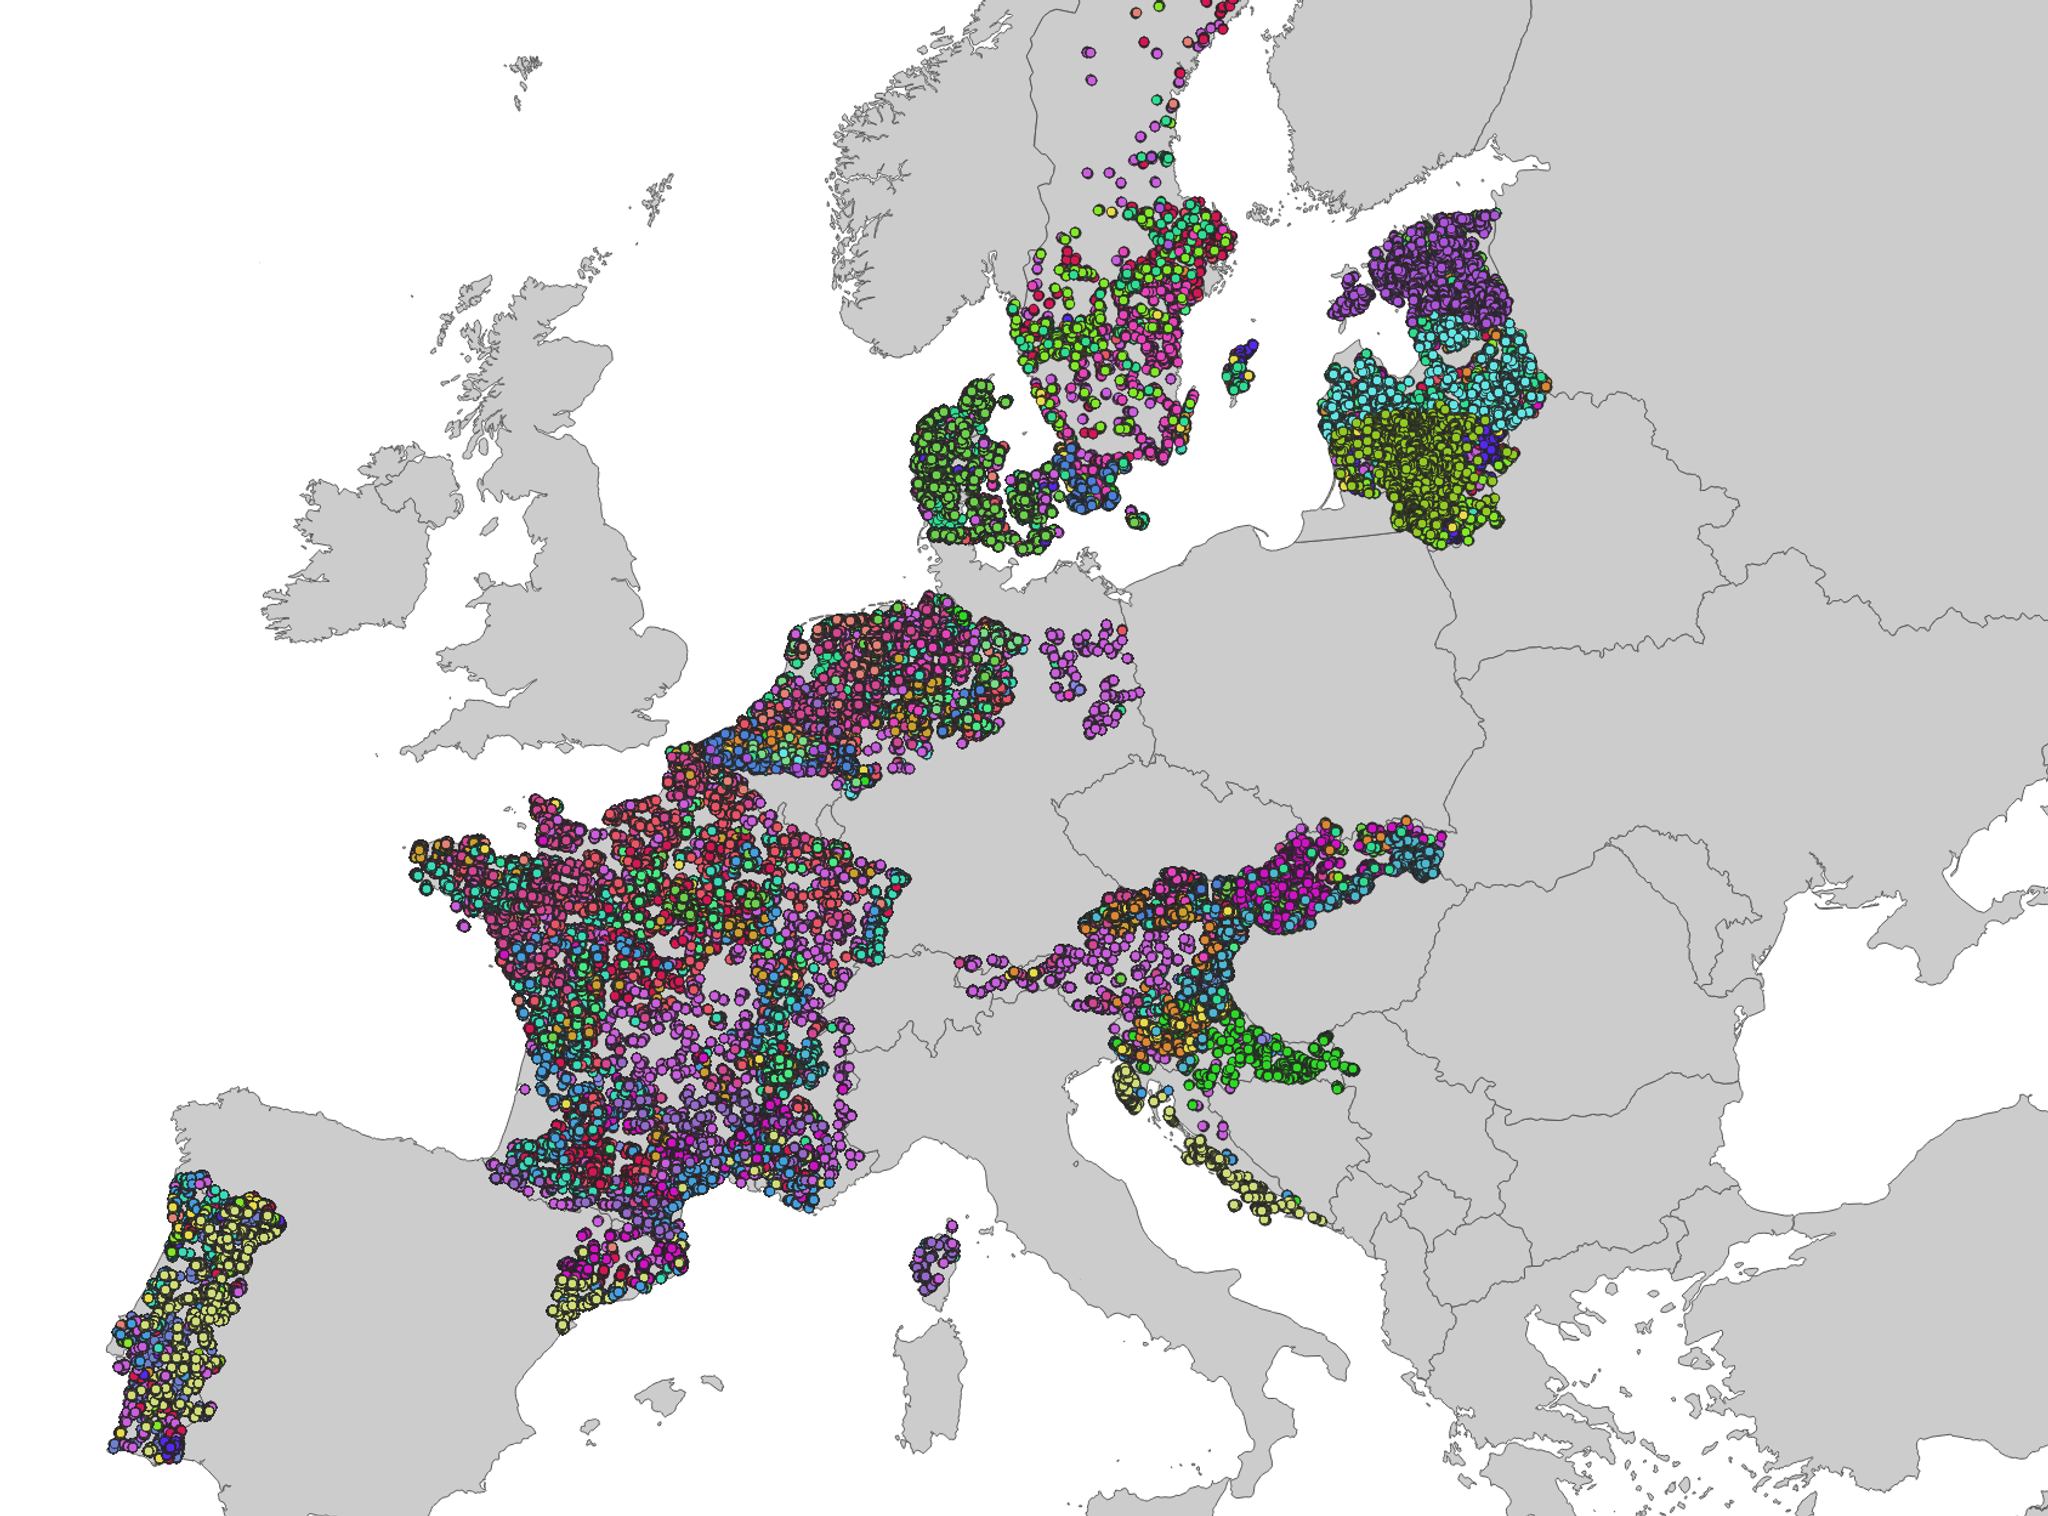
Figure 1 - Location of the training samples used during the training of the model. Different colors represent different crop types.
A good model is only as good as the data it is trained on. For our ground truth data, we started with the EuroCrops dataset, initially covering four European countries (Belgium, Sweden, Estonia, and Slovenia) for a single year each. We significantly expanded this dataset by incorporating data from seven additional countries (France, Germany, Netherlands, Portugal, Denmark, Austria, and Spain) across four years (2018-2021), utilizing the HCAT crop taxonomy and mappings from the EuroCrops project. We refer to this extended dataset as "RapidCrops" which is publicly available on Source Cooperative and Zenodo. RapidCrops was produced under another EU funded project AI4SoilHealth. We focused on the eight most common crop types in each country, resulting in 28 crop classes. To ensure a balanced and representative training set, we randomly selected 587,151 samples from the 2018-2021 data, considering spatial distribution and class balance. Sentinel-2 time series data for these fields — excluding the Coastal Aerosol, Water Vapor and Cirrus bands — were extracted using Area Monitoring to support model training.
To address the challenges of cloudy Sentinel-2 time series and irregular data acquisition, we adapted our previously published transformer-based model [1], originally designed for Planet Fusion daily time series, to handle Sentinel-2 data. This modified model was trained for 100 epochs using the RapidCrops dataset described above. Subsequently, it was integrated into our Area Monitoring System, enabling the processing and prediction of crop types for 51 million fields within a remarkable 4 hours, thanks to the framework's scalable infrastructure.
Evaluation
We evaluated the performance on around 1.5 million RapidCrops fields for the year 2022. The model demonstrated strong overall performance on this unseen year, achieving a weighted F1-score of ~88%. Notably, several major crops, including winter wheat, spring wheat, soybean, grassland, winter oilseed rape, sugarbeet, barley, potato, and vineyard, exhibited F1-scores exceeding 90%. While the model often confused green maize with grain popcorn, its ability to identify corn in general was excellent, resulting in an F1-score of over 98% for the unified 'maize' class.
We analyzed model performance across different field sizes (Table 1). For fields smaller than 1 hectare, the accuracy of Sentinel-2-based predictions was relatively lower (~72%). However, for fields larger than 3 hectares, the model's predictions became more reliable. This trend suggests that the 10-meter spatial resolution of Sentinel-2 imagery can limit the accuracy of crop classification for smaller fields. Furthermore, we observed a significant number of narrow, elongated fields. While some of these fields are larger than 3 hectares, their elongated shape can introduce challenges due to potential "mixing" of spectral signatures from neighboring fields within a single Sentinel-2 pixel. We recommend using Analysis-Ready PlanetScope with higher spatial resolution to minimize the impact of ‘mixing’ problems.
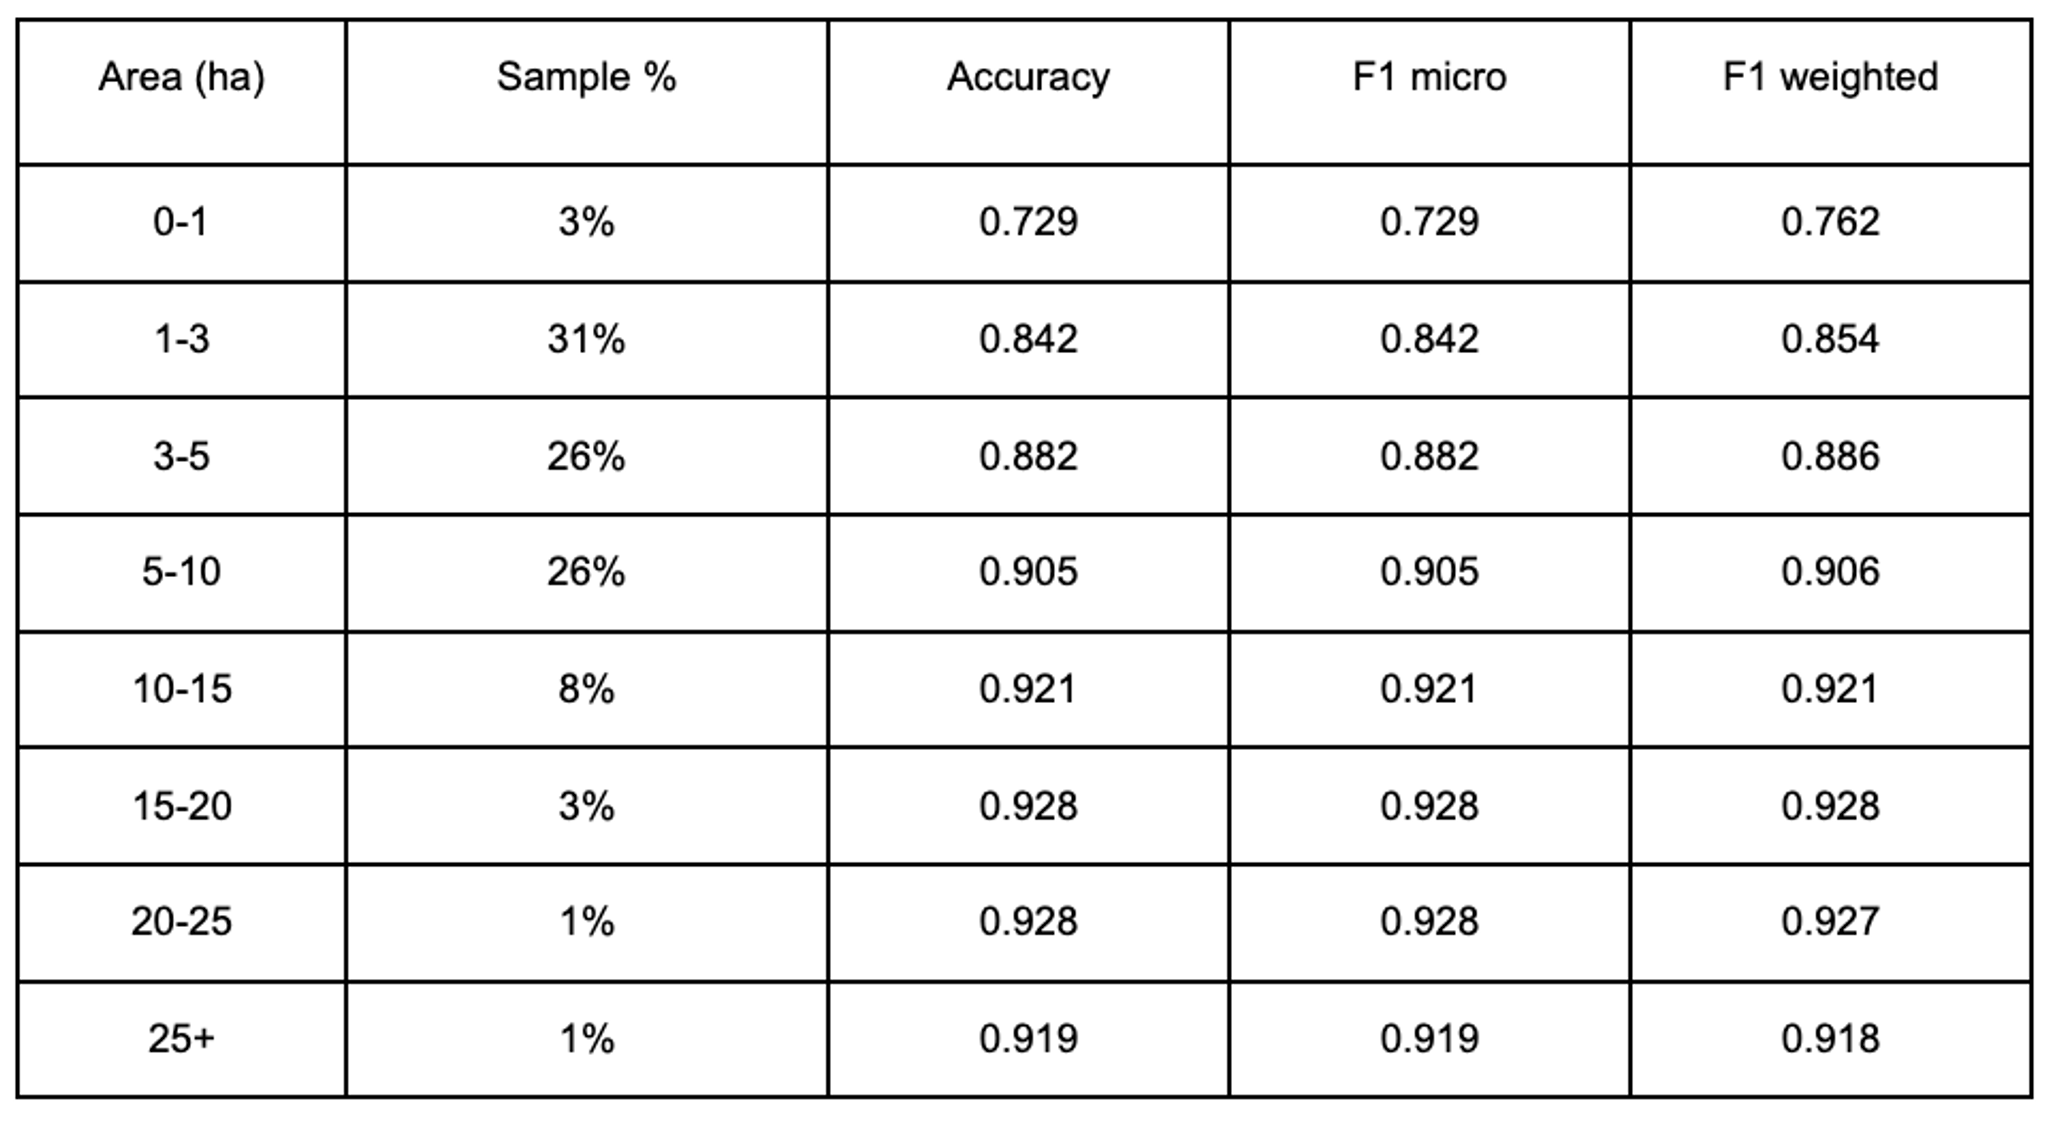
Table 1 - Model Performance across different field sizes
To effectively visualize the spatial distribution and density of classified crops across the vast area covered by our study, we employed a hexagonal tessellation approach. This method divides the map into a grid of uniform hexagons.
For each specific crop type, we calculated the total area of fields classified as that crop within each hexagon for the year 2022. The hexagons are then colored on the map to represent this aggregated area. A darker colored hexagon indicates a higher total area dedicated to that particular crop in that region in 2022, while brighter colors suggest a smaller area. This provides a clear, easy-to-interpret overview of where different crops were most prevalent in 2022. Figures 2-4 show examples for three crops.
Furthermore, to provide context on our training data, the visualization also highlights regions with a majority of the training samples specifically for the crop type being displayed using larger hexagons outlined on the map. These larger hexagons encompass the areas from which we sourced a significant portion of the ground truth data (RapidCrops dataset) used to train our crop classification model for that particular crop. It is important to note that the training data was collected over the years 2018-2021. This demonstrates the model's capability to generalize and classify crops in a year it was not explicitly trained on.
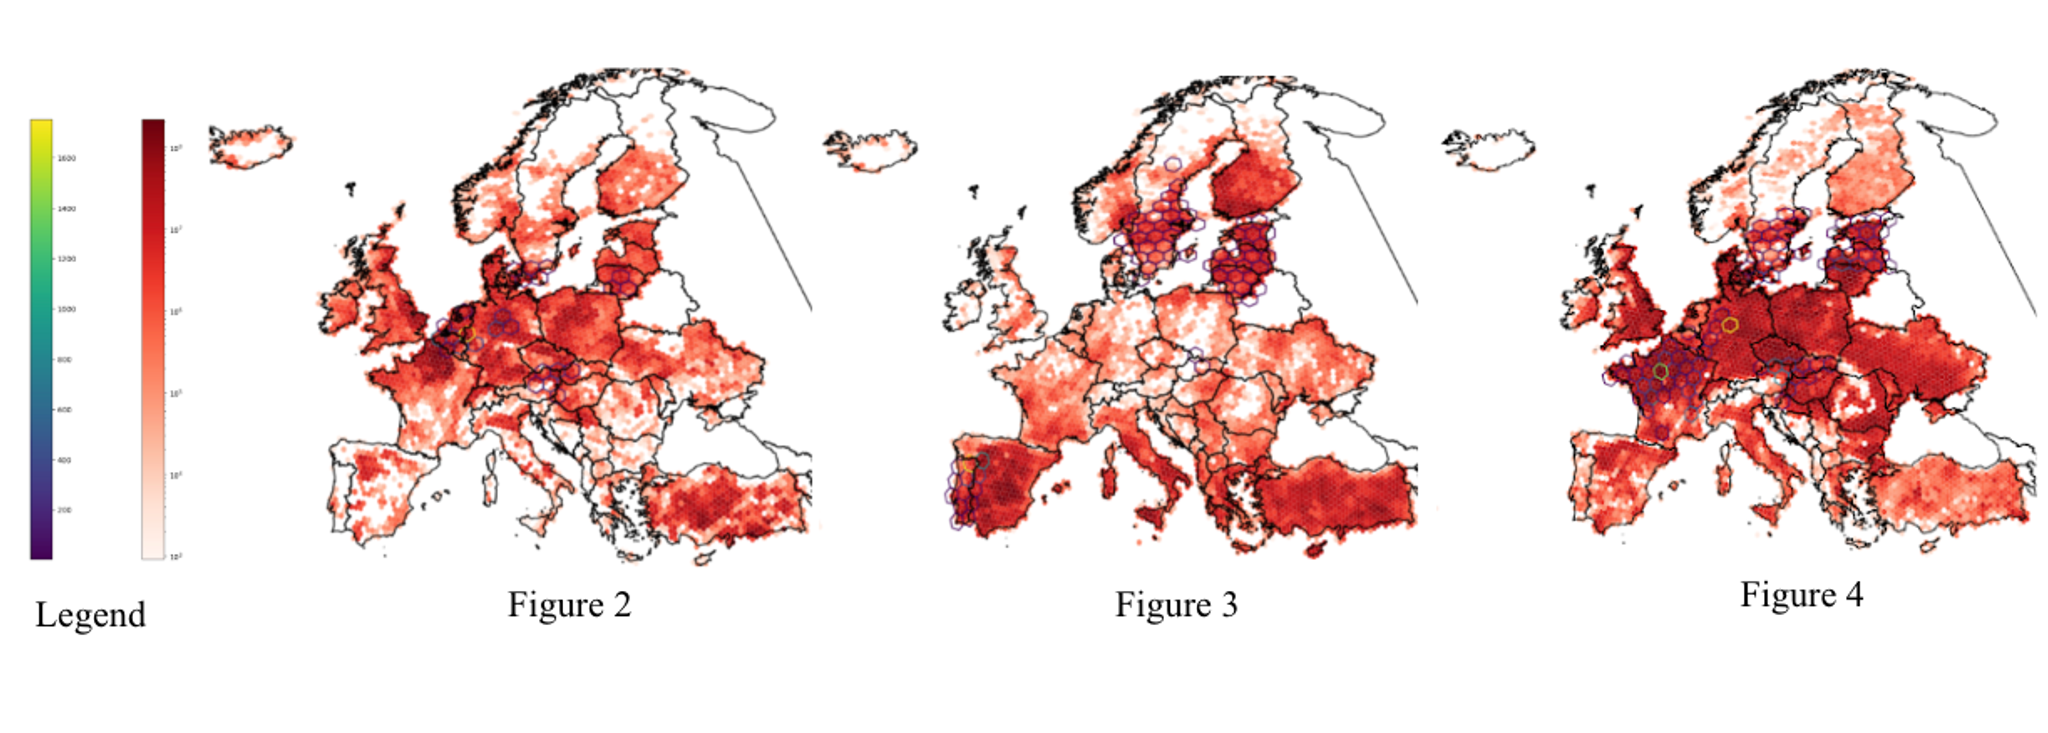
Legend: The left bar shows the number of fields per hexagon (training data) and the right bar shows area of a given crop per hexagon in square meters (classification result). Figure 2: Estimated distribution and area of sugar beet in 2022 across Europe, highlighting training regions (2018-2021). Figure 3: Estimated distribution and area of oats in 2022 across Europe, highlighting major training regions (2018-2021). Figure 4: Estimated distribution and area of rapeseed in 2022 across Europe, highlighting major training regions (2018-2021).
Conclusions
Our recent crop classification study successfully identified 28 crop types, which are among the most common in 15 European countries. Our extensive experience in crop classification, combined with our unique Area Monitoring and Planet Insights Platform infrastructure, enabled us to create a crop map of 51 million fields across Europe. The resulting dataset is publicly available on Zenodo. We used publicly available crop declarations from seven countries to train our model and measure its performance. For the remaining countries, due to the lack of ground truth, we assessed performance using qualitative methods. We also evaluated our pre-trained model for different customers and observed that it provides significant benefits when ground truth data is unavailable. As such it represents a promising alternative to our crop marker which requires same-season crop type declarations as input.
This study demonstrates what could be achieved by leveraging open label and EO datasets, state-of-the-art machine learning technologies and Planet’s platform for building a solution that can support customers in obtaining an essential building block for other crop related applications. While the model trained here may not work on a global scale for all crop types, there is potential to improve the model further, and expand it to other regions. Essential for achieving such are label (ground truth) datasets which can be used to further train the model or even build region-specific models for other regions of the world. A promising practical use of the developed solution goes beyond the demonstrated large scale, continuous crop mapping but it can be used to provide crop type information for smaller regions of interest and areas where no such information is available. We're really excited about the potential of this technology to help farmers and decision-makers make better choices and support a more sustainable future of agricultural production. Of course, this is just the beginning. We're always looking for ways to improve our models and expand their reach, especially to areas where ground truth data is scarce.
References
[1] Senaras C, Holden P, Davis T, Wania A, Rana AS, Grady M, De Jeu R. Early-Season Crop Classification with Planet Fusion. In IGARSS 2024-2024 IEEE International Geoscience and Remote Sensing Symposium 2024 Jul 7 (pp. 4145-4149). IEEE.
Ready to Get Started
Connect with a member of our Sales team. We'll help you find the right products and pricing for your needs.