
How to Reveal the "Why" With Hyperspectral Data

For years, satellite data has helped us see and understand change. But sometimes, we’re still left guessing at the cause. That gap, the difference between seeing a stressed crop or an unhealthy environment and knowing why, can result in significant costs or wasted resources.
In our recent webinar, Agile EO: Beyond the Visible, we share how Tanager™, Planet’s first hyperspectral satellite, delivers a new level of spectral detail — to help you move from seeing to knowing.
If you missed the live event, you can watch the on-demand webinar now to get the full details and see the data in action. For an overview of the game-changing insights Tanager unlocks, keep reading.
Closing the Spectral Blind Spot
Most Earth observation satellites are not capable of imaging a wide range of wavelengths. This limitation leaves organizations vulnerable to real-world consequences, such as unnoticed invasive species, crop yield decline, or undetected methane emission events.
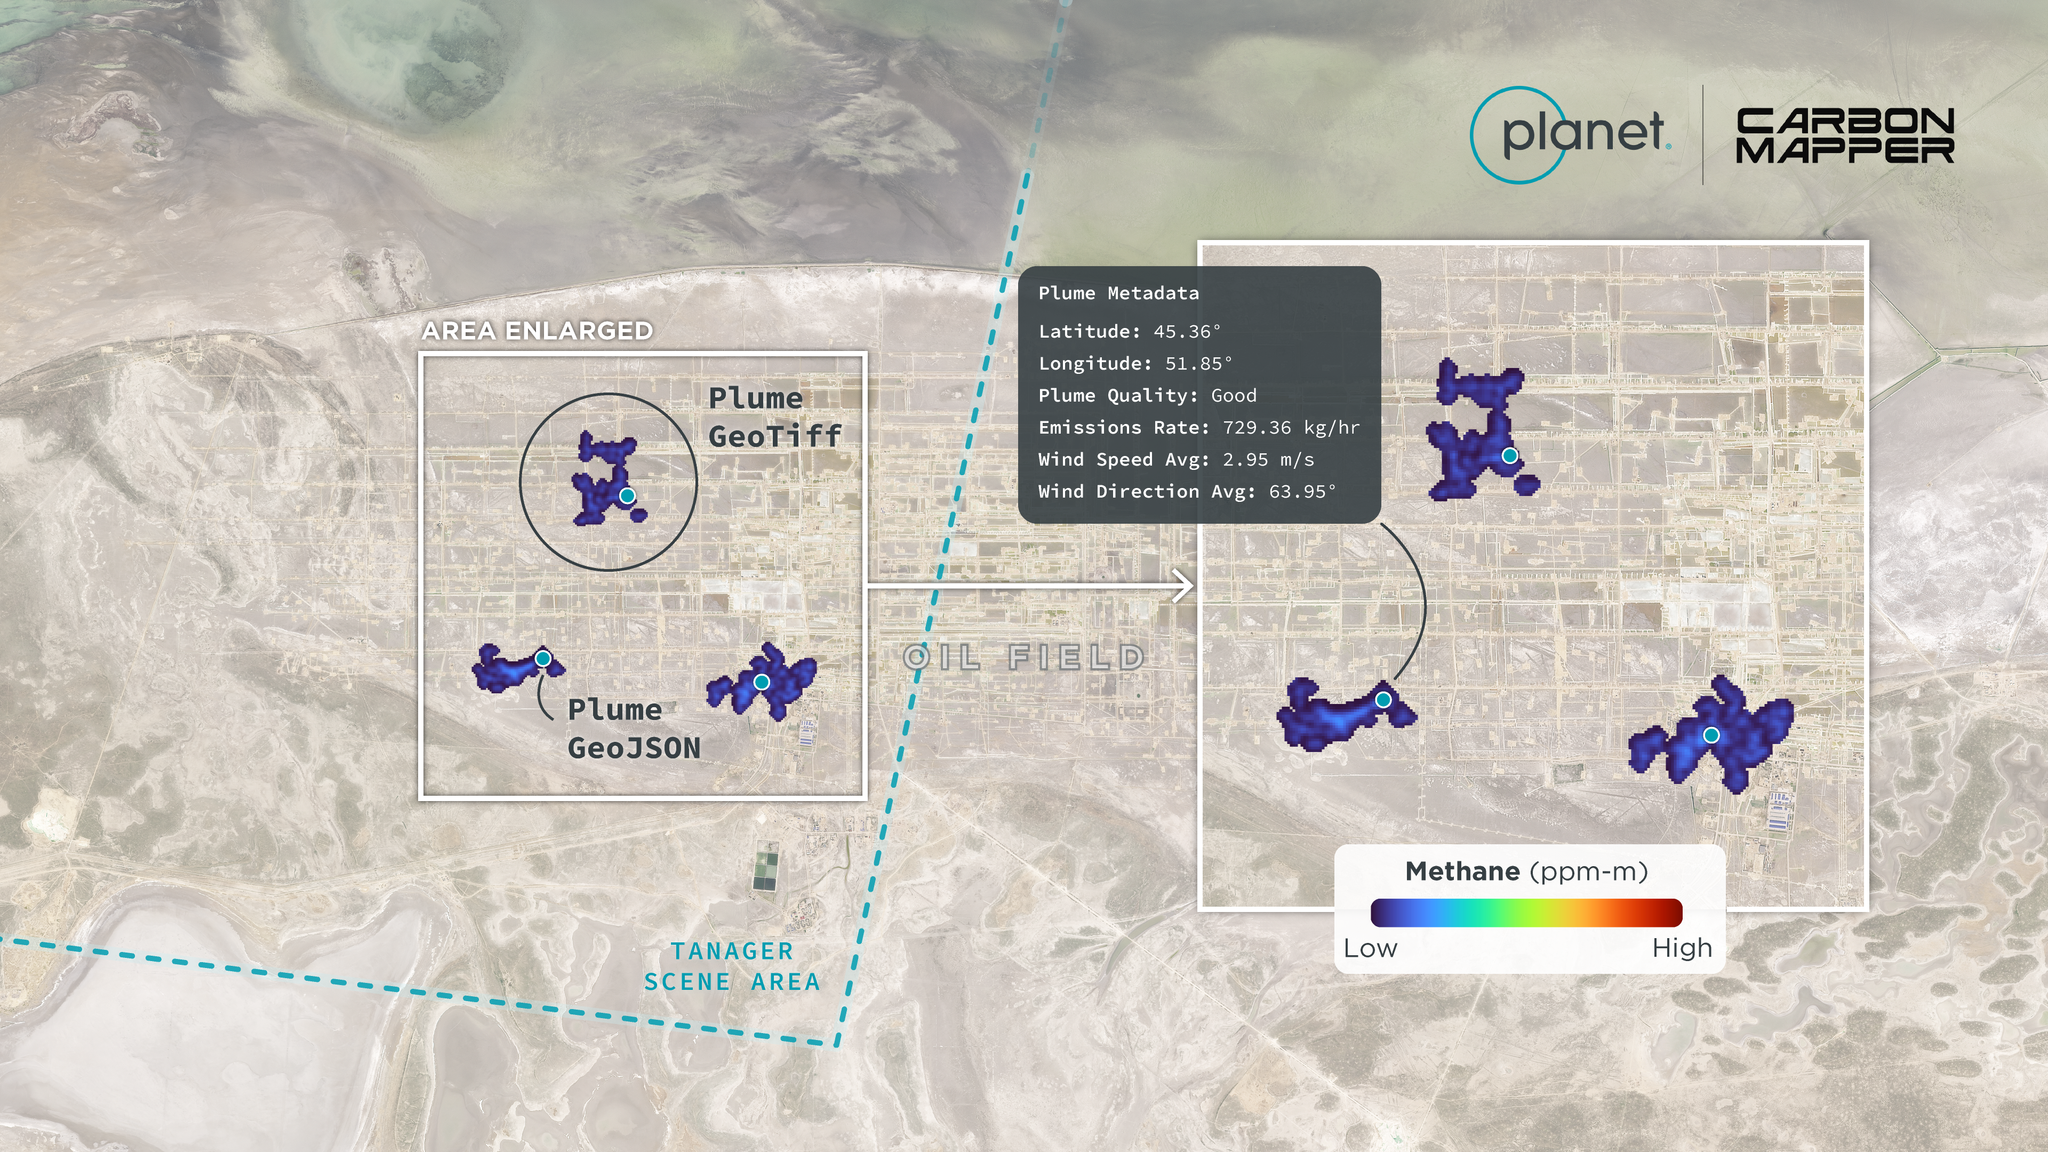
This graphic highlights the Tanager Methane data products, showing how plumes are detected and associated with rich metadata including emission rate, emission uncertainty, local wind conditions and more to support rapid analysis and mitigation.
Tanager reduces this blind spot by capturing the full Visible to Shortwave Infrared (VSWIR) spectrum. With over 400 spectral bands and 30-meter spatial resolution, it provides hyperspectral data that helps monitor what can't be seen by the human eye.
And as we like to say at Planet: You cannot manage what you do not measure.
Game-Changing Use Cases: From Oil Spills to Super-Emitters
Tanager is the newest addition to Planet’s constellations, unlocking the spectral dimension to complement the time dimension of PlanetScope® and the spatial dimension of SkySat® and Pelican™.
Tanager hyperspectral data supports a range of powerful outcomes, including:
Verifying the Impact of Oil Pollution
Vegetation stress can be detected with traditional multispectral imagery, but it's hard to pinpoint the root cause. With hyperspectral imagery, data from across the electromagnetic (EM) spectrum can be used to analyze very narrow bands of light that are known to interact with specific materials, often revealing the cause of the stress.
This is especially relevant for identifying the impact of oil pollution on vegetation health. For example, after the Deepwater Horizon oil spill, one of the largest marine oil spills in history, hyperspectral data was used to identify impacted marshlands in Louisiana by looking at narrow sections of the EM spectrum where oil strongly absorbs — enabling a more targeted and effective response to remediation efforts.
Identifying Methane Super-Emitters
Innovation and transparency are key to addressing methane emissions. Most monitoring systems overlook the small number of sites responsible for the majority of emissions since they’re not getting the full spectral picture. Tanager closes this gap by identifying these super-emitters, enabling faster action and verified reductions. The result is greater operational efficiency, reduced product loss, and credible progress toward methane-intensity goals all of which build trust with stakeholders. Our partner, Carbon Mapper, found that less than 1% of infrastructure can be responsible for about 40% of emissions depending on the region. Tanager is built to close this critical blind spot. It delivers unmatched methane sensitivity, with a 90% probability of detection at 90 to 180 kg per hour for point source emissions under standard conditions — 3 m/s wind and medium bright scene. This capability is critical for reducing compliance risk and cost-effectively addressing the biggest leaks faster.
This idealized visualization highlights Tanager’s ability to capture broad areas such as energy producing regions.
This idealized visualization highlights Tanager’s ability to capture broad areas such as energy producing regions.
Flexible Access: Data Tailored to Your Needs
With Tanager now generally available, Planet offers scalable and flexible access options, whether you need imagery, methane products, or both.
- Tasking: Think of this as on-demand access. Tasking allows you to reserve a date and time, or define a collection window for your specific area of interest. Tanager can even operate in multiple sensitivity modes to produce clearer, more detailed measurements based on your needs.
- Methane Monitoring Subscription: This newly released option makes emissions tracking simple and predictable. Instead of per-collection fees, you subscribe to a flat rate per square kilometer per year for dedicated revisit frequency in key basins. Methane detections are provided as actionable intelligence, including the estimated emission location, rate, uncertainty, and wind data.
Ready to Look Deeper?
For more details on everything covered in this article, watch the complete webinar or explore sample code and additional resources in Planet Community.
Or if you’re ready to tackle your most challenging problems or build derived products using Tanager data, connect with our sales team or your Planet representative. We’d love to hear from you.
Ready to Get Started
Connect with a member of our Sales team. We'll help you find the right products and pricing for your needs.