How Do Earth Observation Analytics Detect Objects, Changes, and Patterns at Scale?

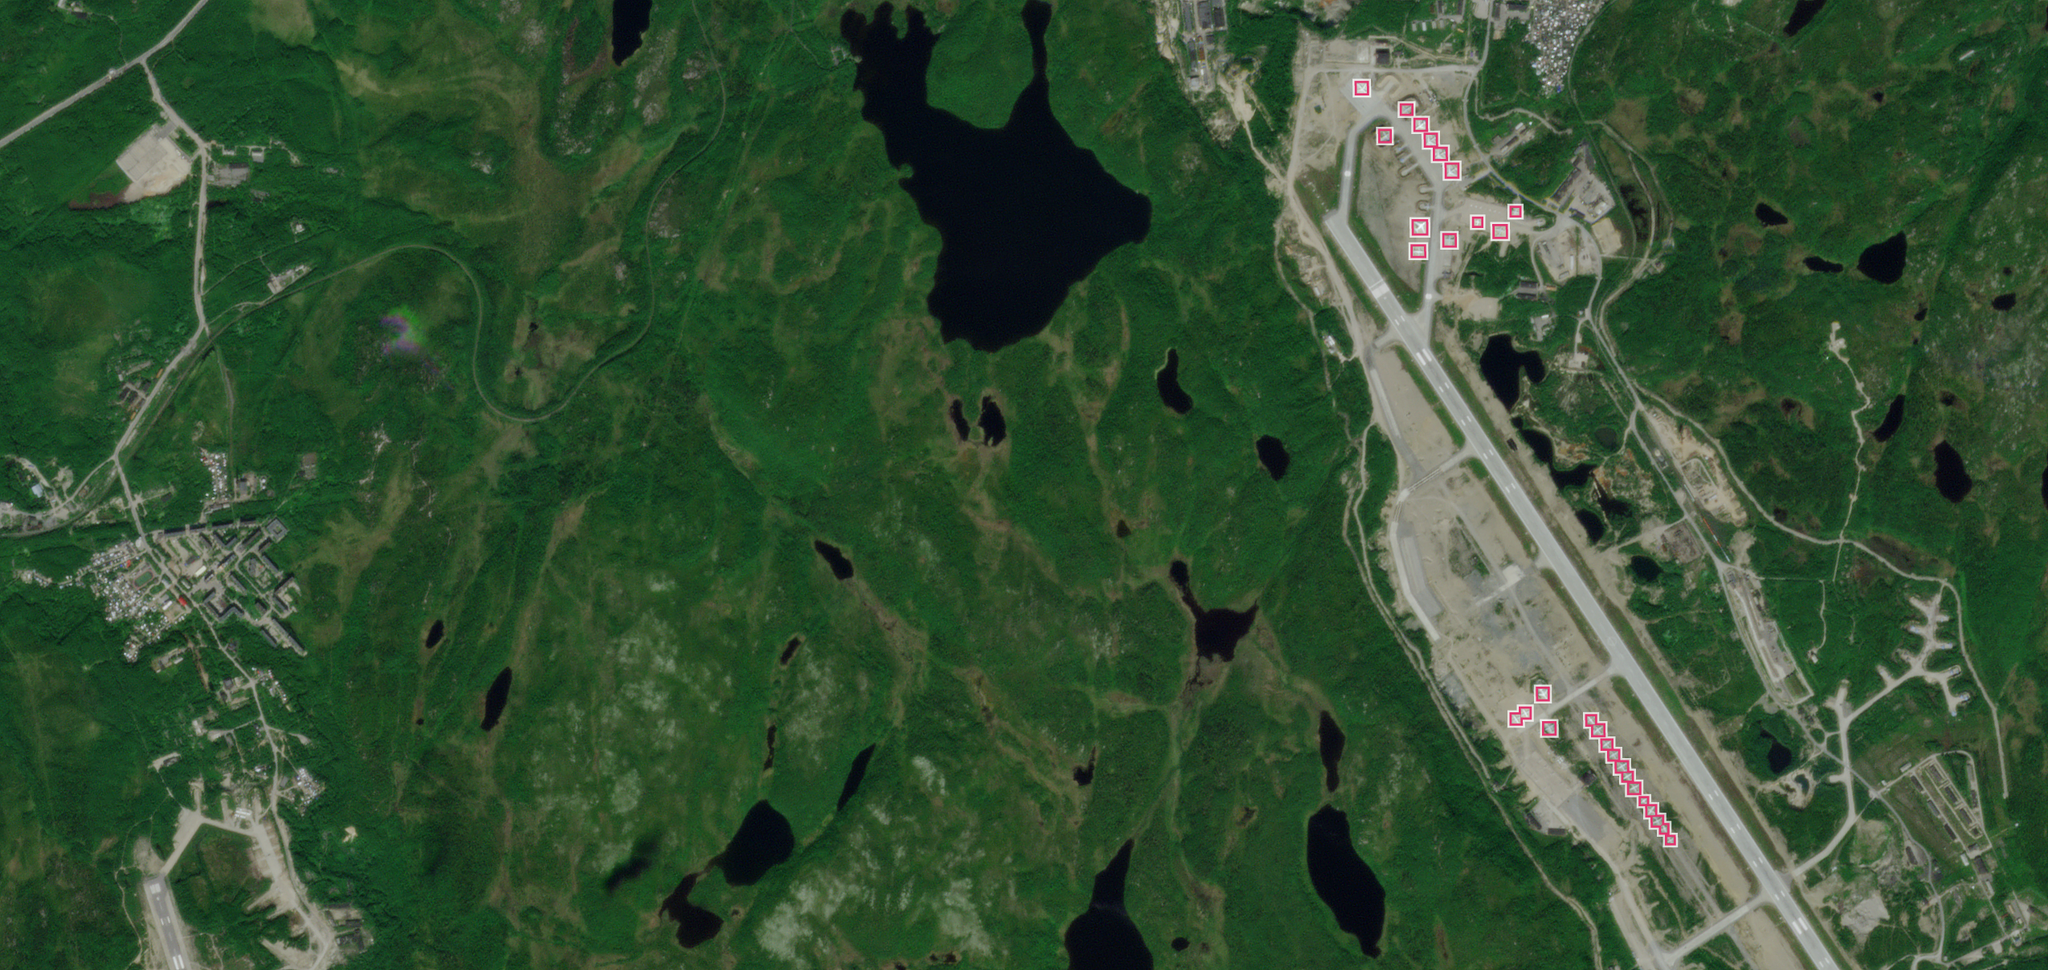
PlanetScope image of the Severomorsk-1 Naval Air Base captured July 18, 2025. Aircraft detection with Planet EO analytics. © 2025, Planet Labs PBC. All Rights Reserved.
EducationSatellites capture an enormous volume of imagery of the Earth’s surface every day. These repeated observations make it possible to monitor change across large and remote areas, but they also create a practical challenge: there is far more imagery than people can review manually, and some conditions cannot be identified through visual inspection alone. Earth observation (EO) analytics help overcome these challenges.
Using techniques including computer vision, deep learning, and spatial processing pipelines, EO analytics can convert satellite data into targeted intelligence. Let’s explore how these analytical workflows operate and how they unlock scalable insights from satellite data.
How EO Analytics Work
EO analytics encompass a broad range of techniques used to extract information from satellite data. Some, such as spectral analysis and time-series analysis, are well-established approaches. Others use machine learning and artificial intelligence (AI) to automate more complex tasks, including detecting objects, classifying land cover, and identifying unusual patterns.
The process typically begins with large volumes of satellite data, which are cleaned, calibrated, and prepared to ensure consistency across locations and time periods. Different analytical methods can then be applied depending on the question being asked. These may measure spectral characteristics, compare observations over time, or use trained models to recognize particular objects, conditions, and patterns.
The results can be delivered as structured data feeds, such as object counts, classifications, measurements, or the percentage of an area affected by change. These outputs can then be integrated into monitoring systems, alerts, and operational workflows.
Here are some of the analytical approaches used across Planet products and solutions:
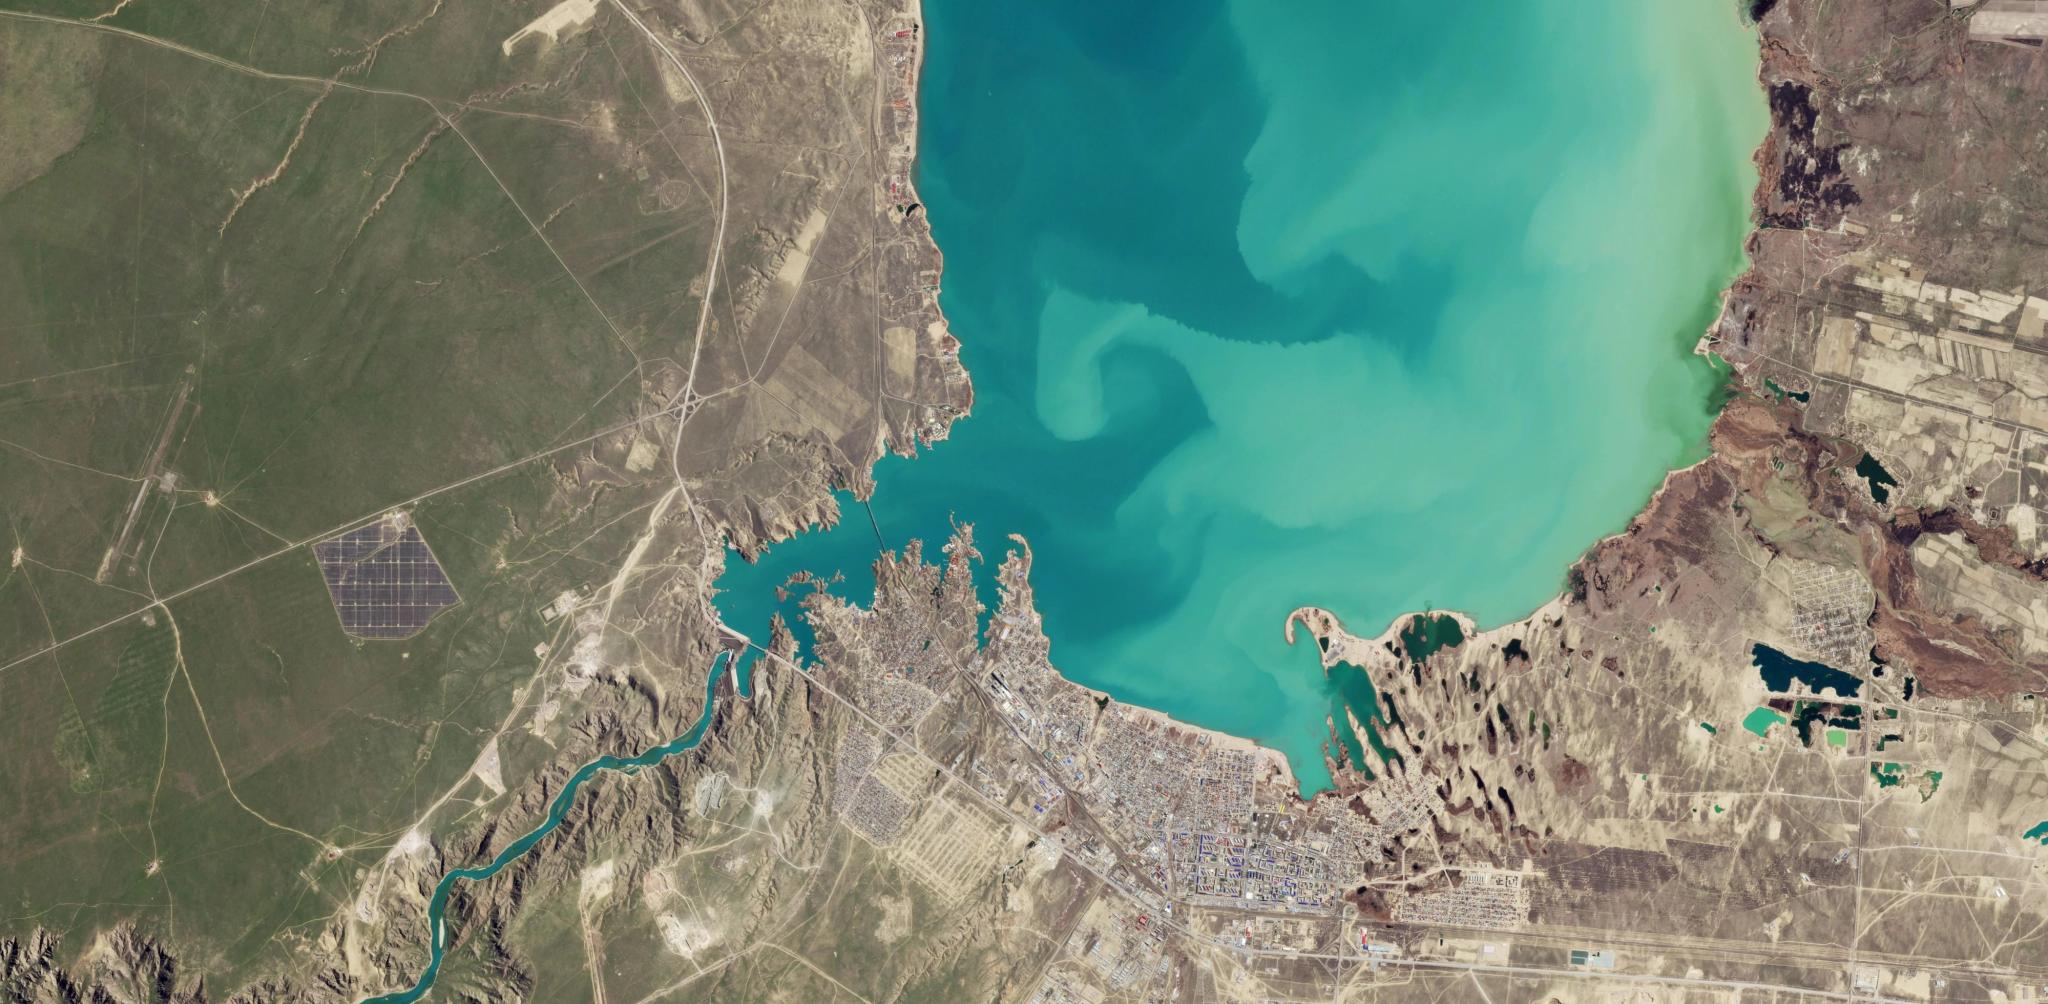
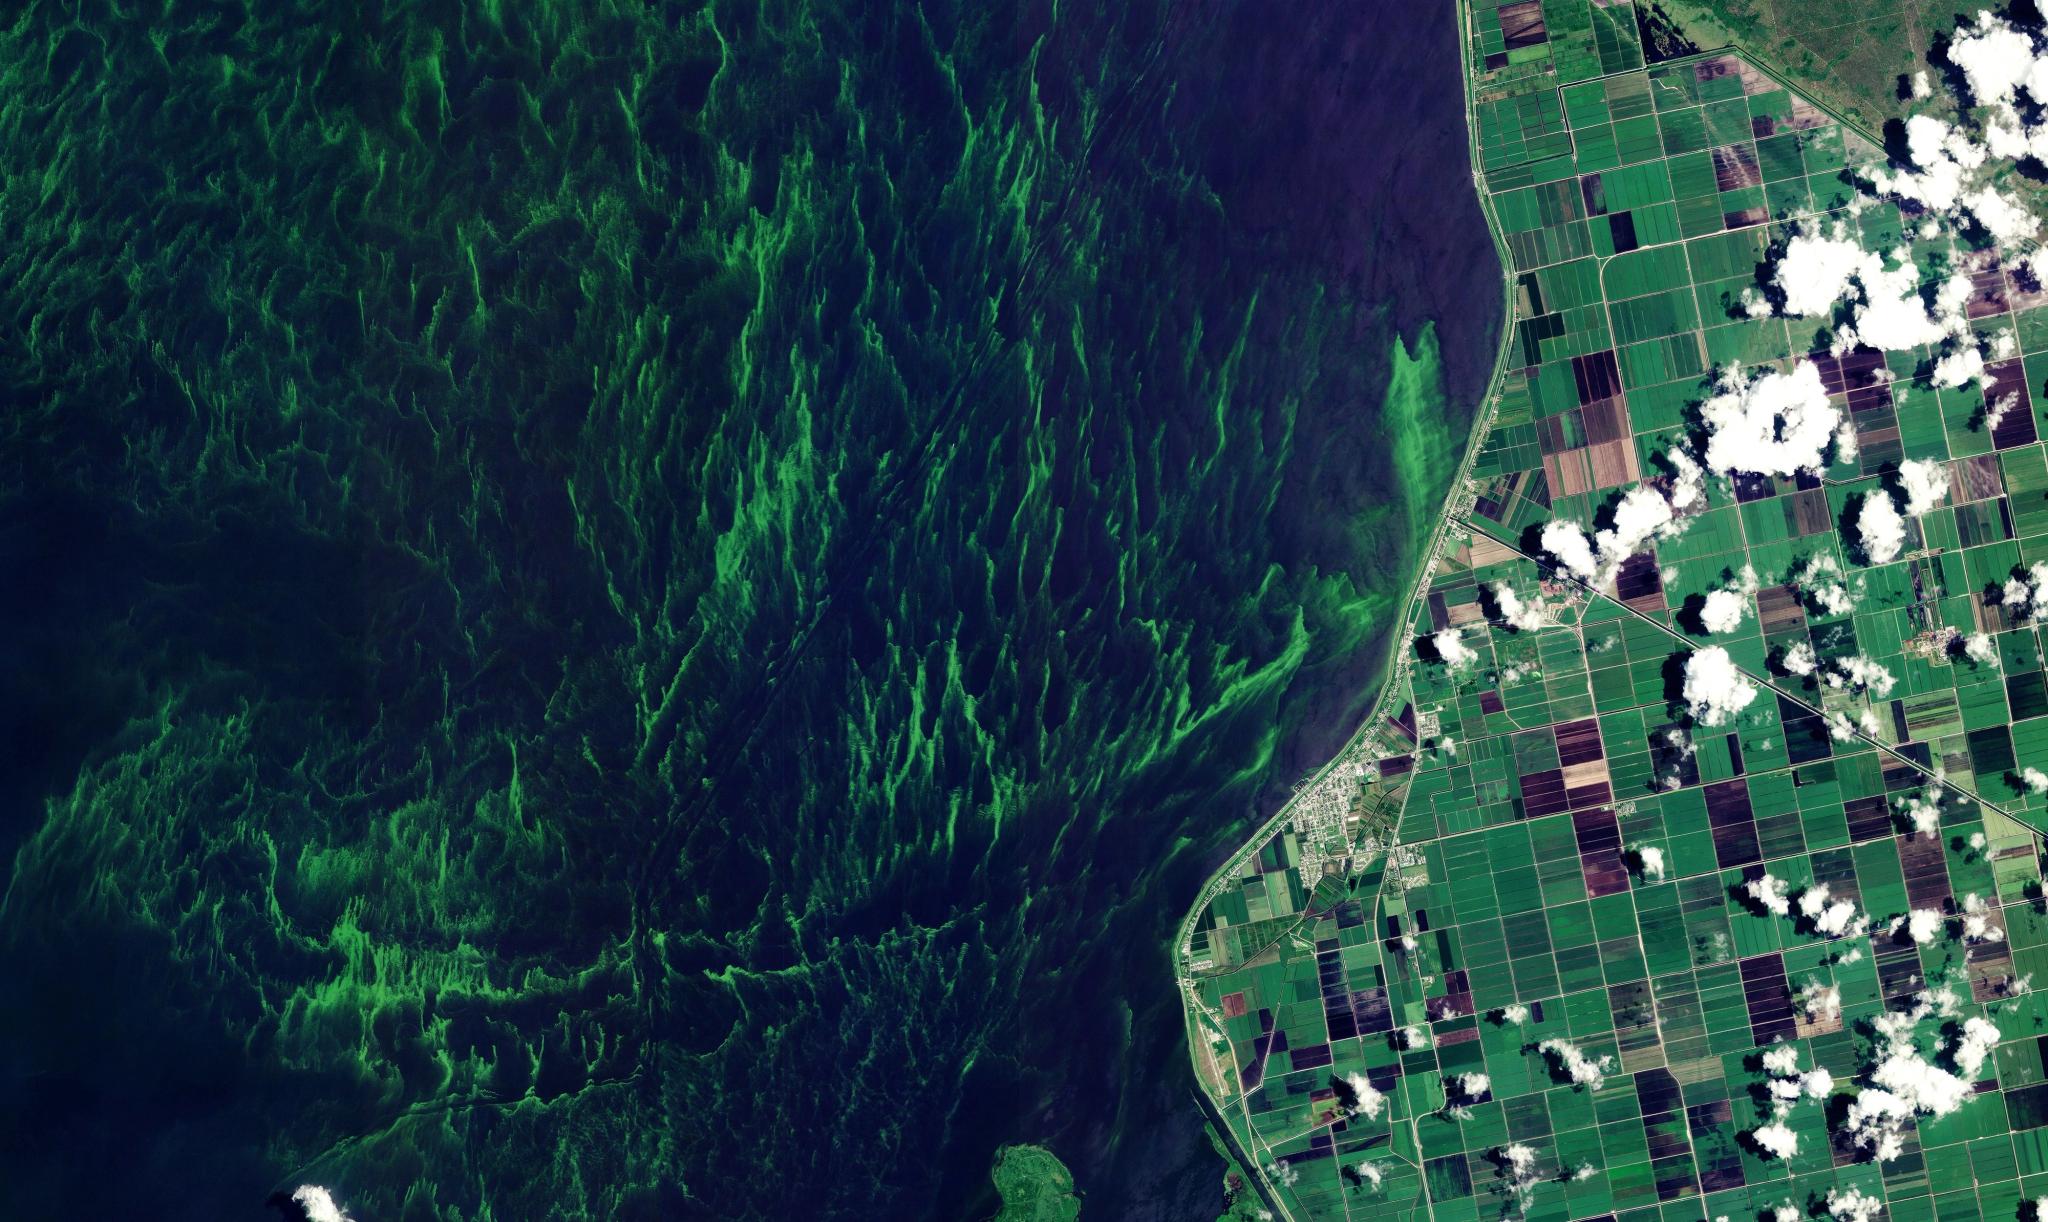
- Spectral analysis: Indices such as NDVI and NDWI, along with spectral mixture analysis, can reveal environmental dynamics that may not be visible to the human eye, such as vegetation health, soil moisture, and water quality.
- Time series analysis: Dense temporal stacks of analysis-ready data can be used to monitor changes and trends over time.
- Computer vision: Deep learning models, including convolutional neural networks (CNNs), can automatically detect, count, and classify visible features.
- Large vision models and vector embeddings: Large vision models and spatial embeddings can support natural-language applications, making EO more accessible by allowing users to ask questions directly.
Together, these approaches expand what can be measured and understood from satellite imagery.
Types of Objects and Features That Can Be Detected From Satellite Imagery
Machine learning models, including CNNs, can be trained to detect a range of man-made and natural features. Here are just a few examples.
- Human-made infrastructure: Roads, buildings, aircraft, and maritime vessels for supply chain, port monitoring, and defense.
- Agriculture and vegetation: Crop classification, planting/harvesting cycles, canopy health, and potential deforestation.
- Hydrological dynamics: Mapping surface water boundaries, flood inundation, and coastal change.
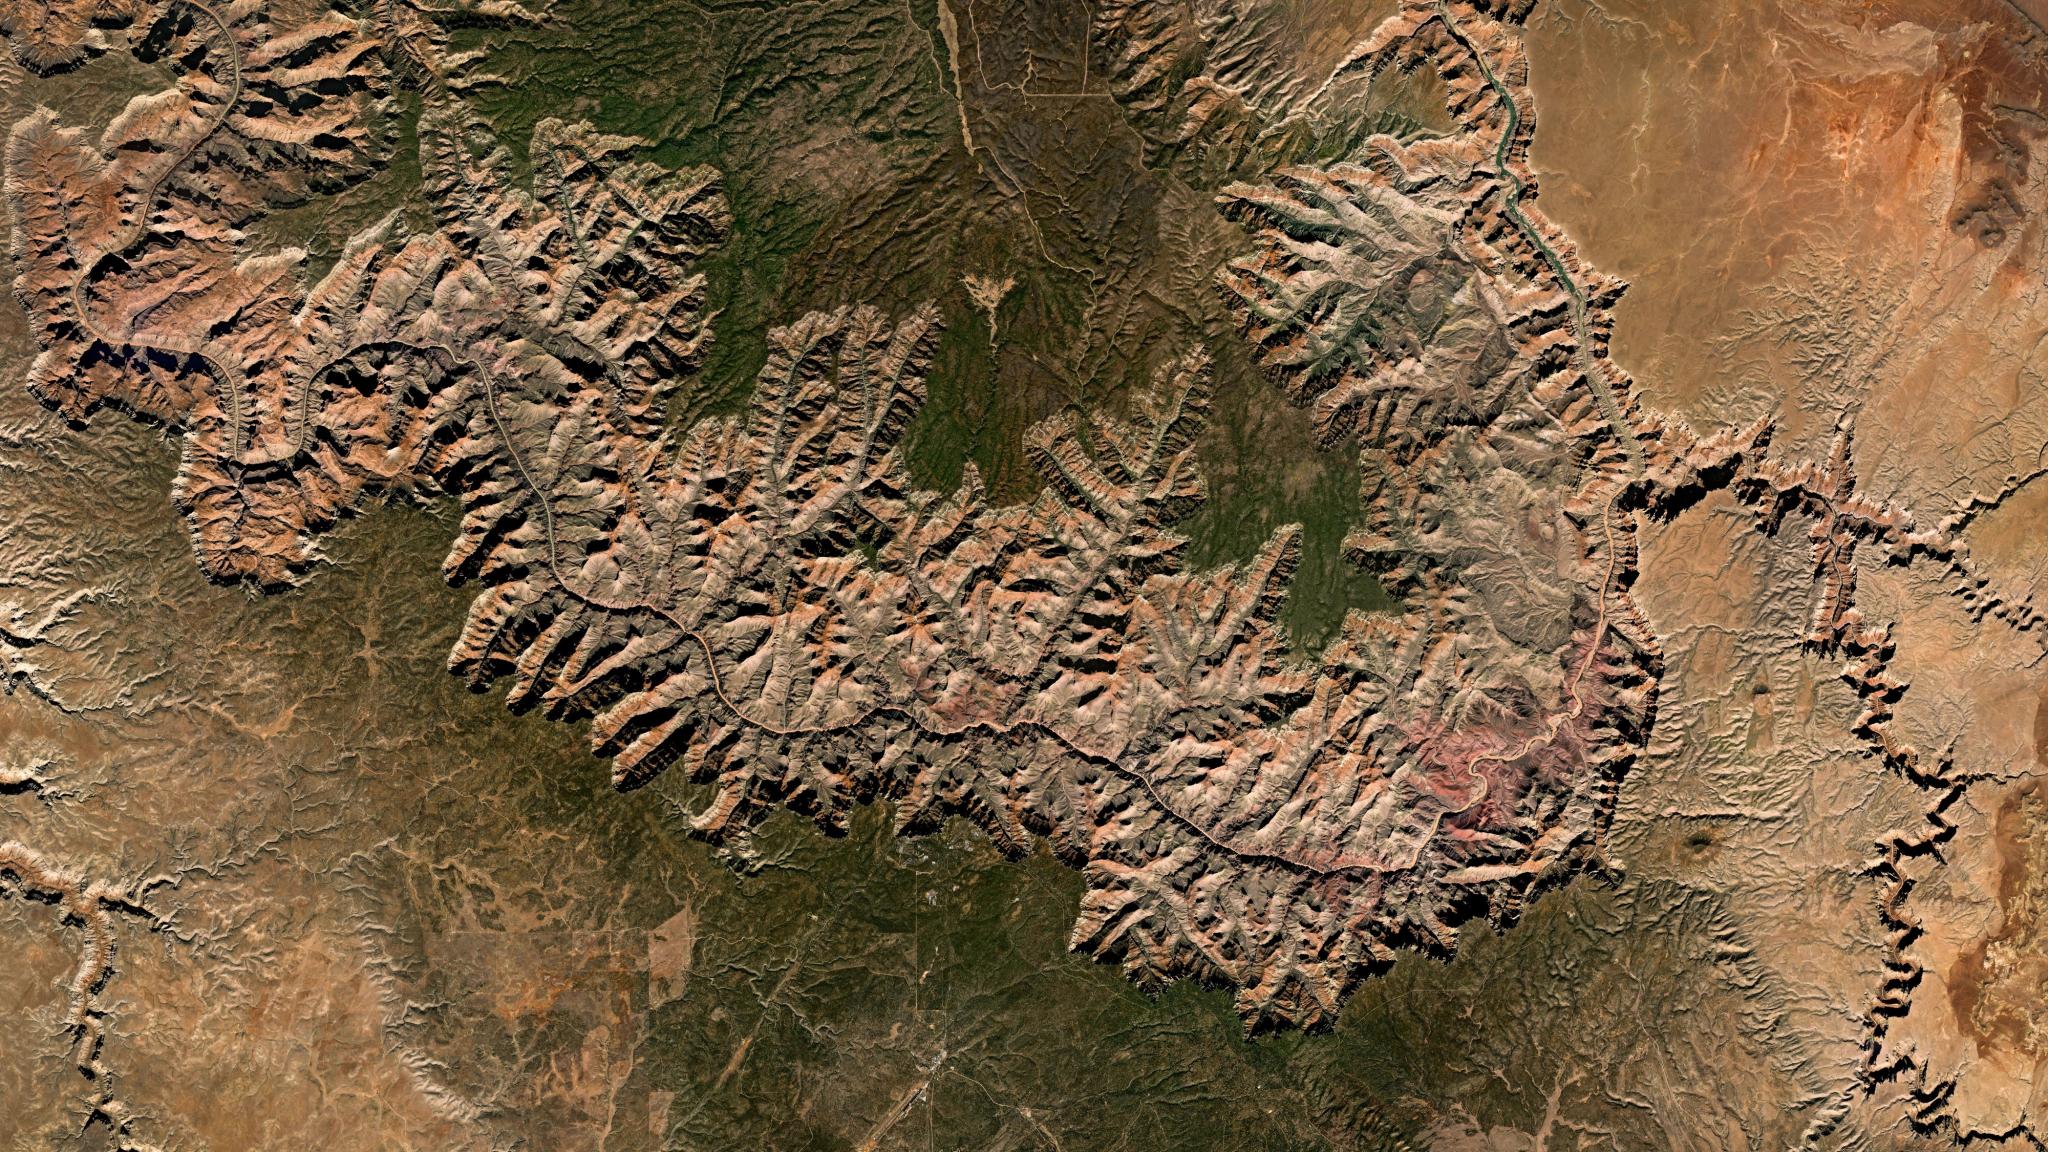
- Complex spatial patterns: Spatial embeddings can be used to recognize regional signatures, such as urban expansion trends or changing land-use profiles.
It’s important to note that detection accuracy depends on spatial resolution (level of detail), atmospheric conditions (cloud cover), and temporal resolution (how often an area is imaged). High spatial detail helps identify what is there, while high-cadence imaging, such as that collected from PlanetScope®, helps ensure changes are captured when they occur.
From Pixels to Action: Automated Alerts and Workflows
While EO analytics are powerful on their own, their value is dramatically amplified when they are integrated into systems that turn detections and measurements into automated alerts and decision-support workflows.
Anomaly Identification
These systems use archival satellite data to benchmark normal activity and apply EO analytics to automatically flag new or unexpected changes.
For example, the Planet Global Monitoring System is built to monitor areas of interest across in near-real time and issue automated alerts for anomalies. Agencies use Planet GMS to detect a range of patterns and objects, including roads, buildings, aircraft, and vessels, helping to improve their situational awareness and response times.
Signals and Markers
These systems apply threshold or traffic-light systems (red/yellow/green) to continuous analytics feeds.
For example, the Planet Area Monitoring Service is designed to help government agencies monitor, validate, and report on agricultural activity at the field level and support the timely payment of subsidy claims. It uses signals (data time series) and markers (AI-generated classifications) to provide field-level context. A configurable traffic light system then applies a bespoke decision tree to transform that data into actionable compliance decisions.
These systems help bridge the gap between data and action, allowing EO insights to support a wide range of workflows and policies.
Learn More
If you'd like to learn more about EO analytics, you can continue reading the questions and answers below or visit the Planet website. For those interested in building their own models, the developer documentation provides detailed instructions on how to access and process Planet Analytics feeds.
Questions You Might Have
Automated change detection identifies meaningful events by comparing two or more images of the same location taken at different times. The software looks for differences in pixel values that indicate a change, such as the arrival of new equipment, the clearing of land, or the progression of construction projects. To ensure accuracy, the system must account for seasonal variations such as snow cover or changing shadows that might otherwise be mistaken for real change.
Once these variables are filtered out, the remaining differences highlight significant activities that require attention or further investigation. This capability allows users to focus on important developments without manually scanning thousands of square miles.
Key Takeaway: Change detection is the process of identifying significant shifts in satellite imagery over time — specifically, identifying where new development (such as roads or buildings) has occurred.
Users monitor target locations by defining an area of interest (AOI), a bounding polygon set in geospatial software. Rather than sifting through global datasets, the processing pipeline uses these coordinates to automatically isolate, analyze, and deliver data for that specific zone.
This targeted approach allows machine learning models to trigger timely alerts when key events occur inside the AOI, such as a new road being paved or new structure appearing. By bounding the search area, organizations can continuously monitor large asset portfolios without being overwhelmed by irrelevant data.
Key Takeaway: Defining an AOI focuses automated analytics pipelines on target coordinates, delivering instant alerts without data overload.
Artificial intelligence (AI) is the core engine that enables the rapid classification and interpretation of billions of pixels within satellite imagery. Machine learning models are trained on large sets of labeled images so they can recognize complex patterns and objects with high precision. These AI systems can detect subtle indicators of change that a human observer might miss, such as the early signs of crop stress or minor shifts in industrial production.
Key Takeaway: AI serves as the primary tool for rapidly classifying complex patterns and maintaining data consistency across global imagery.
EO analytics can identify broad patterns such as the rate of urban expansion, the spread of deforestation, or the shifting health of global supply chains. By aggregating data from thousands of locations, researchers can see how economic activity is moving across a region or how natural disasters are impacting local environments.
These large-scale observations reveal the cumulative effect of many small changes, such as the gradual increase in global shipping traffic or harvesting activity across agricultural fields. Identifying these patterns helps organizations understand systemic risks and opportunities that are only visible from a broad perspective. This bird’s-eye view provides the context needed for regional planning and environmental protection.
Key Takeaway: Analytics reveal systemic global trends by aggregating data to show the cumulative effect of small physical changes over large geographic areas.