
Generating 51 Million Field Boundaries Across Europe
The Value of Field Boundaries
By: Sara Verbič & Matic Lubej
In agriculture, a field is the fundamental management unit, and accurately delineating its boundaries is essential for understanding their size, shape, and spatial distribution. Globally, there is over 1.5 billion hectares of cropland, comprising more than 1.2 billion active field boundaries that undergo constant changes with agricultural seasons.
From food security and supply chain traceability to precision farming, delineating field boundaries is crucial for a variety of applications, providing valuable data on agricultural management, services, practices and policies.
What is Field Boundaries Planetary Variable?
Field Boundaries is one of Planet’s enabling Planetary Variables containing a set of polygons marking the extent of each agricultural field and providing a critical data layer.
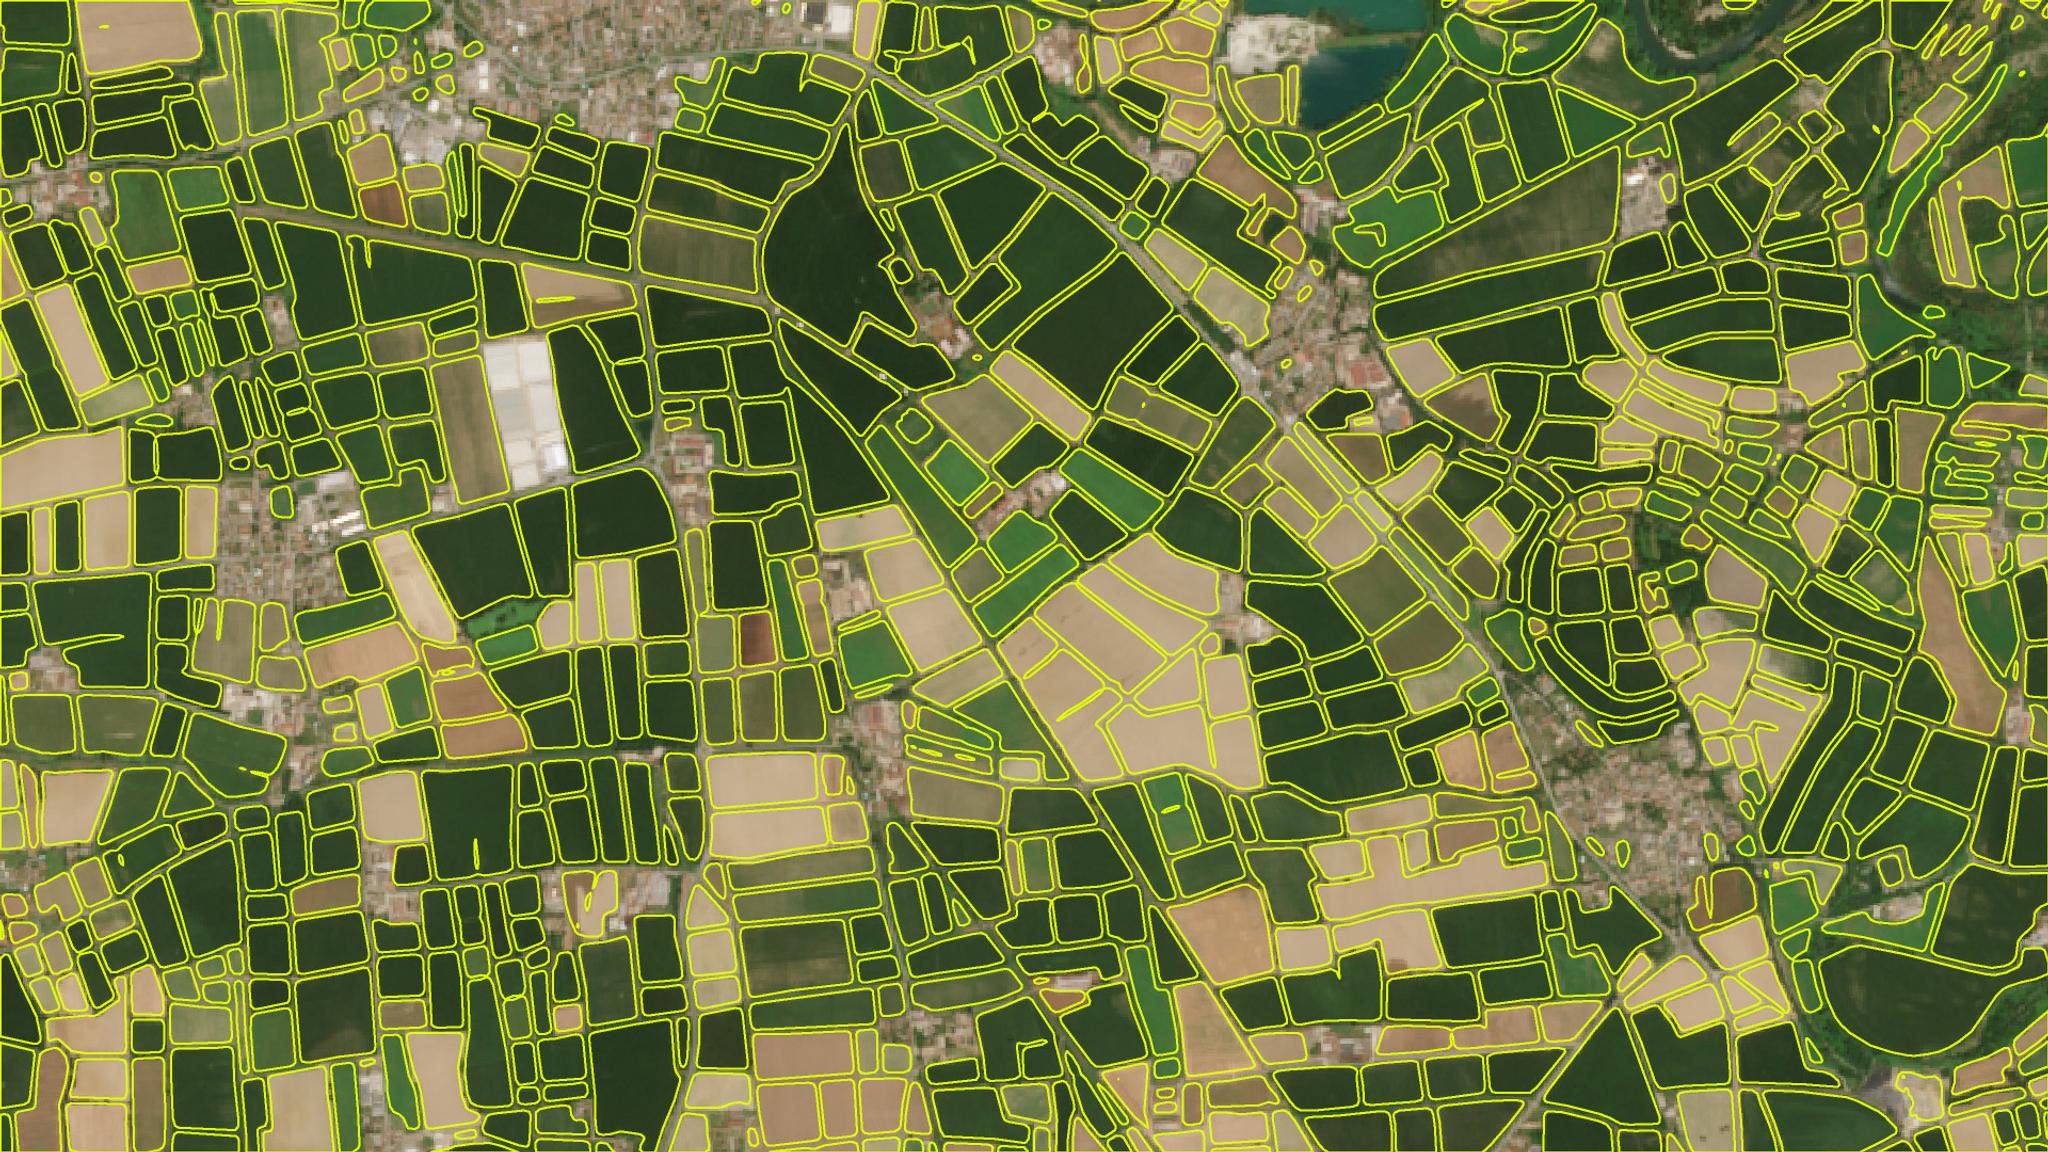
Utilizing Sentinel-2 satellite imagery, our proprietary algorithm leverages the similarity of spatial, spectral, and temporal properties of pixels belonging to the same field. Using a deep neural network based on the U-Net architecture, we estimate the parcel’s extent and boundary from a time series of images. Then, we convert this image into a vector, where each polygon represents the unit of agricultural land used for a single crop.
More information about the Field Boundaries product can be found in the Field Boundaries Technical Specification report and on the Planet Developers webpage.
Open Earth Monitoring Project
The Open Earth Monitor Cyberinfrastructure (OEMC) project, a collaborative research project funded by the European Union, has enabled the opportunity to make the first large-scale use of Planet's infrastructure to efficiently generate field boundaries over nearly the vast majority of Europe. The project’s primary goal is to enhance Europe’s ability to produce timely, accurate, and accessible environmental information derived from Earth Observation (EO) data.
As part of efforts to develop a European crop monitoring system, we have successfully created a dataset of 51 million field boundaries, now publicly available in fiboa-compliant GeoParquet format on source.coop and Zenodo. Following the generation of the field boundaries, we extracted time series data and performed crop classification, which we’ll explore in more detail in our upcoming blog post.
How We Did It
We used our existing product, Field Boundaries, to generate the field boundaries for the area of interest (AOI) in Europe. This was done by processing Sentinel-2 data from June 2022, resulting in the identification of a total of 89,515,633 field boundaries.
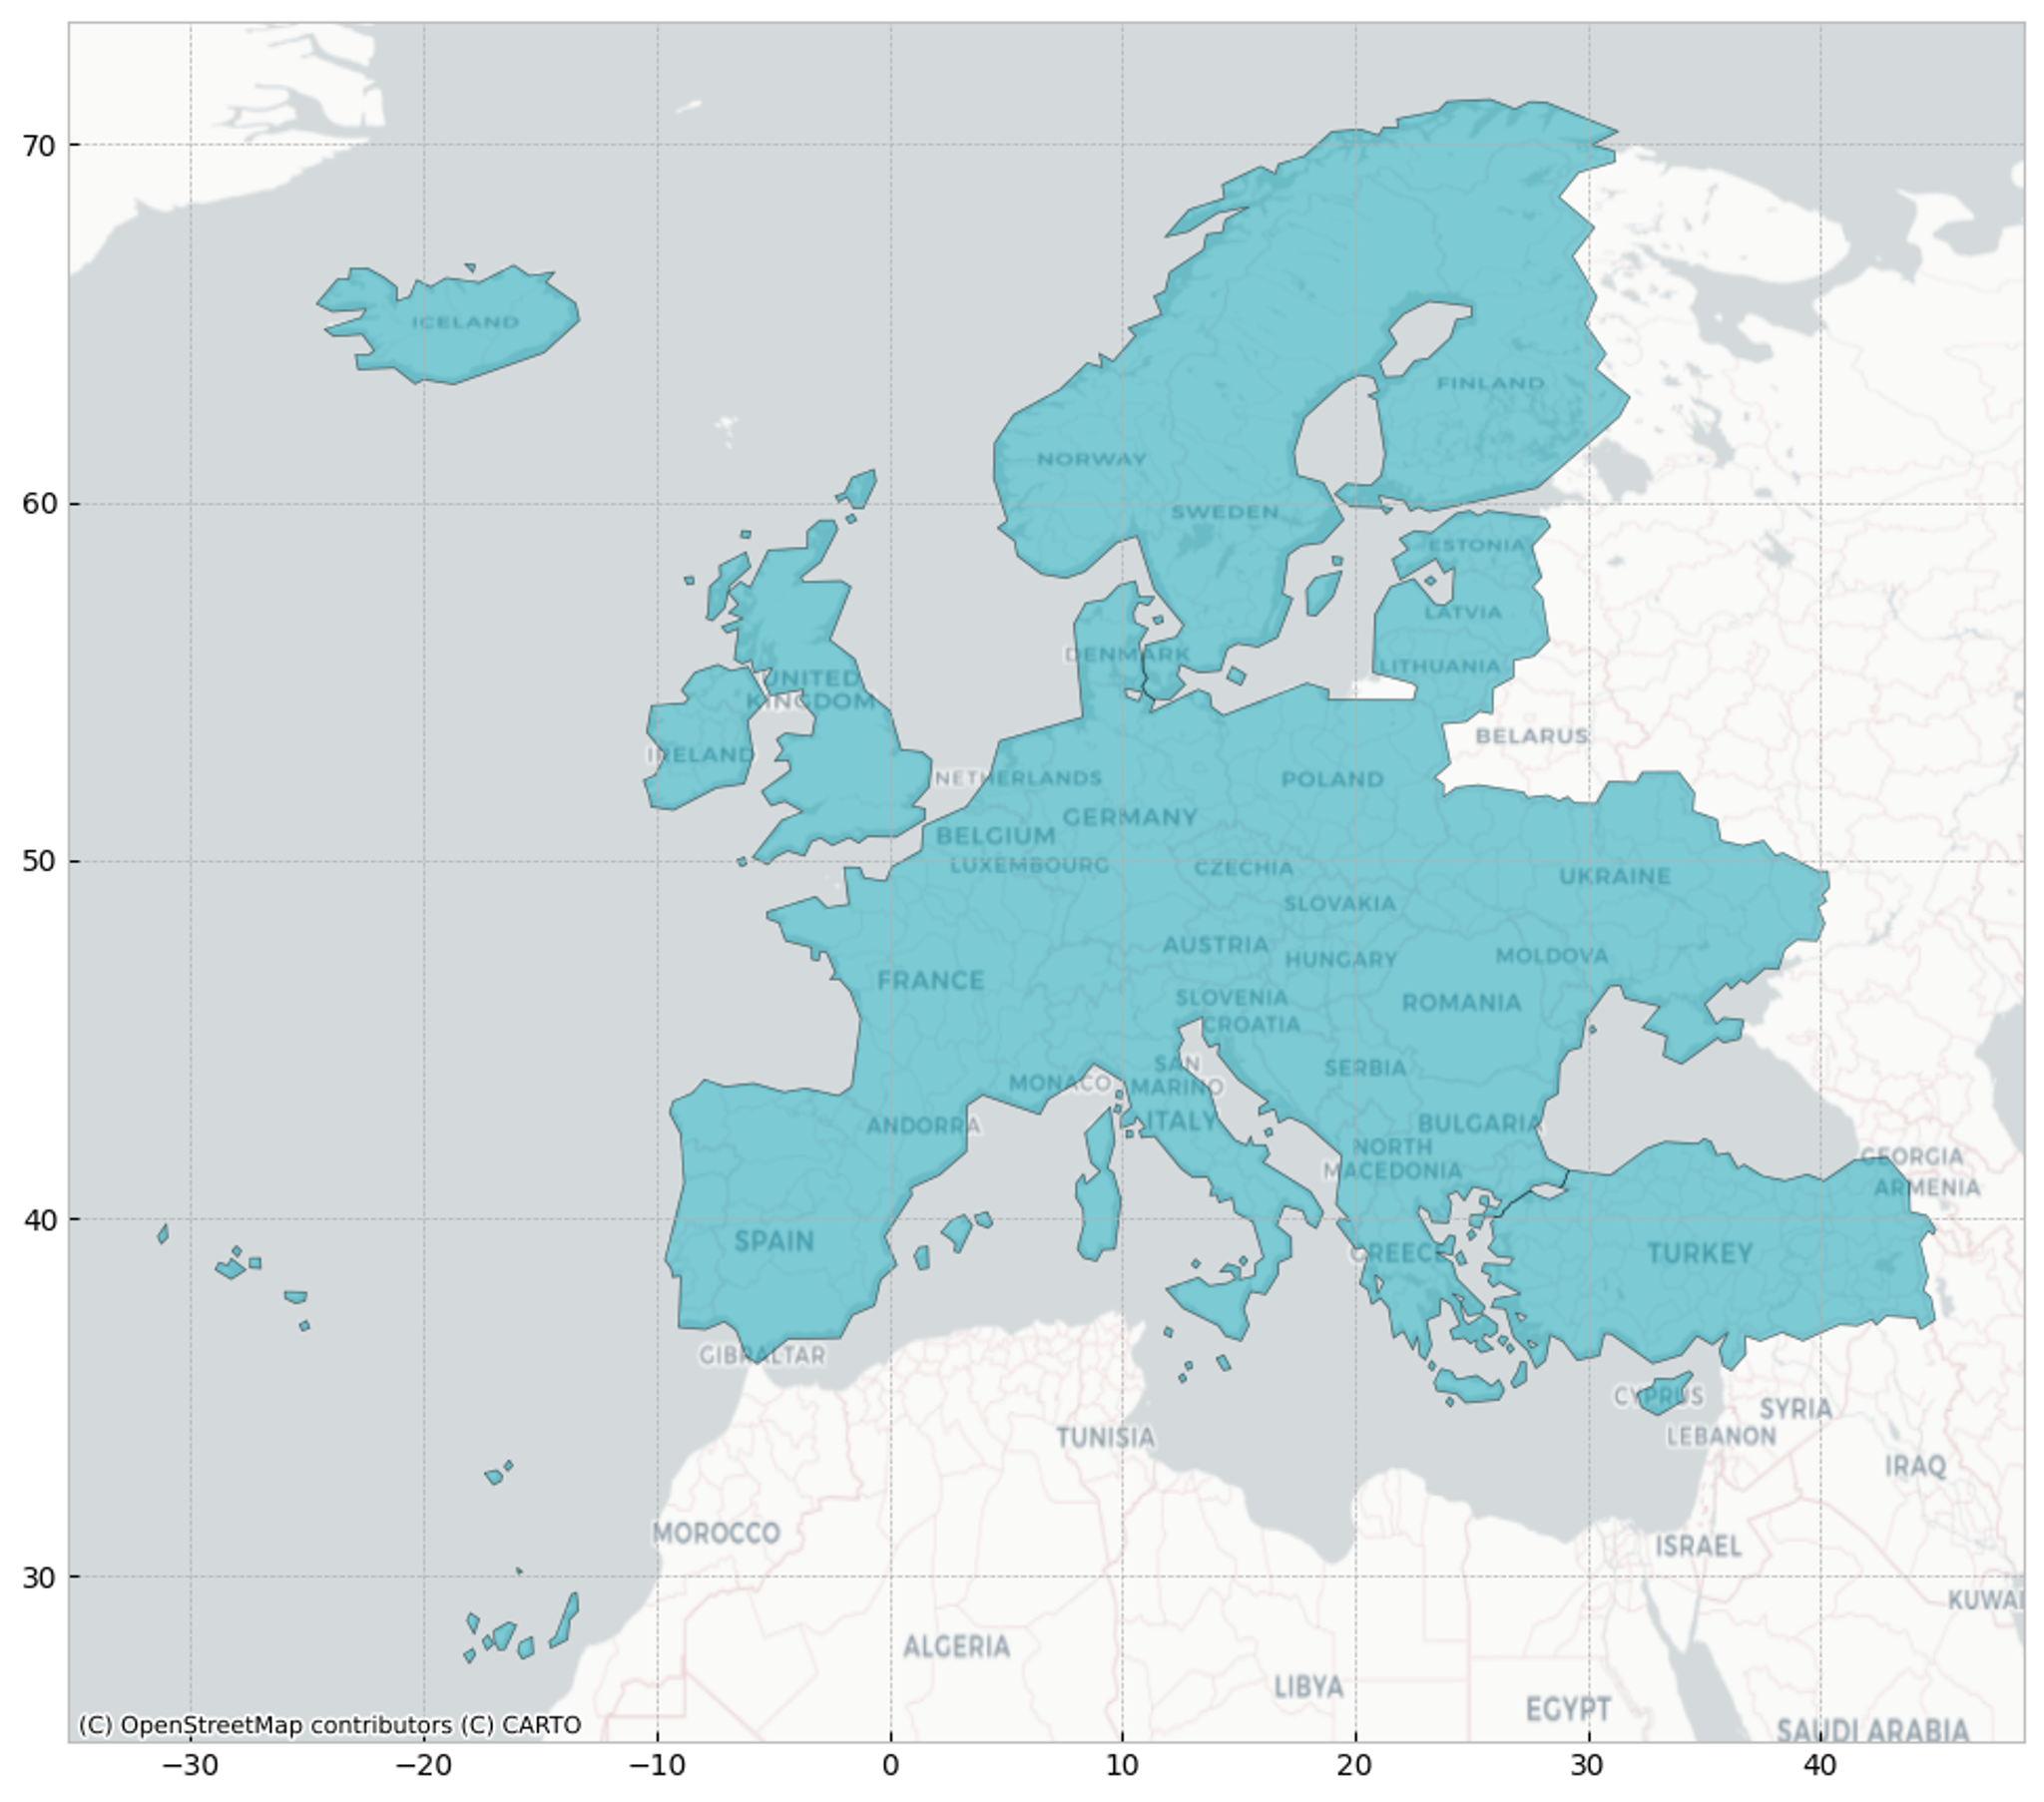
Figure 1: Area within which field boundaries were generated.
We performed a series of filtration steps to refine the dataset, to help ensure better results and relevance.
Validation-based filter
The first step was to identify and exclude field boundaries that were too narrow or extended beyond the dataset’s available area. A key metric here was the Maximum Inner Circle Diameter (MICD), which is an attribute included in the output of our product and serves as the indicator of the minimum width required for accurate delineation. The accuracy of the Field Boundaries product is influenced by the resolution of satellite imagery. For Sentinel-2 imagery we have determined that the MICD threshold for accurate delineation is 30 meters. As a result, field boundaries with MICD values below 30 meters were flagged and removed. This filtering process led to a 24.5% reduction in the original dataset, leaving approximately 67.6 million high-quality fields.
Land-cover-based filter
Next, we filtered out delineations over non-agricultural areas using a Land Use/Land Cover map. We relied on 2022 LULC data from Impact Observatory, Microsoft, and ESRI (available also as a Sentinel Hub collection).
By overlaying field boundaries on the LULC data, we filtered out fields over non-crop areas (e.g. water, snow). The majority LULC class per hexagonal cell was plotted, showing that most cells were dominated by crops, with some rangeland and tree-dominated cells in regions like Norway and Sweden. Visual checks identified false-positive detections, especially in tree-dominated areas, which were removed.
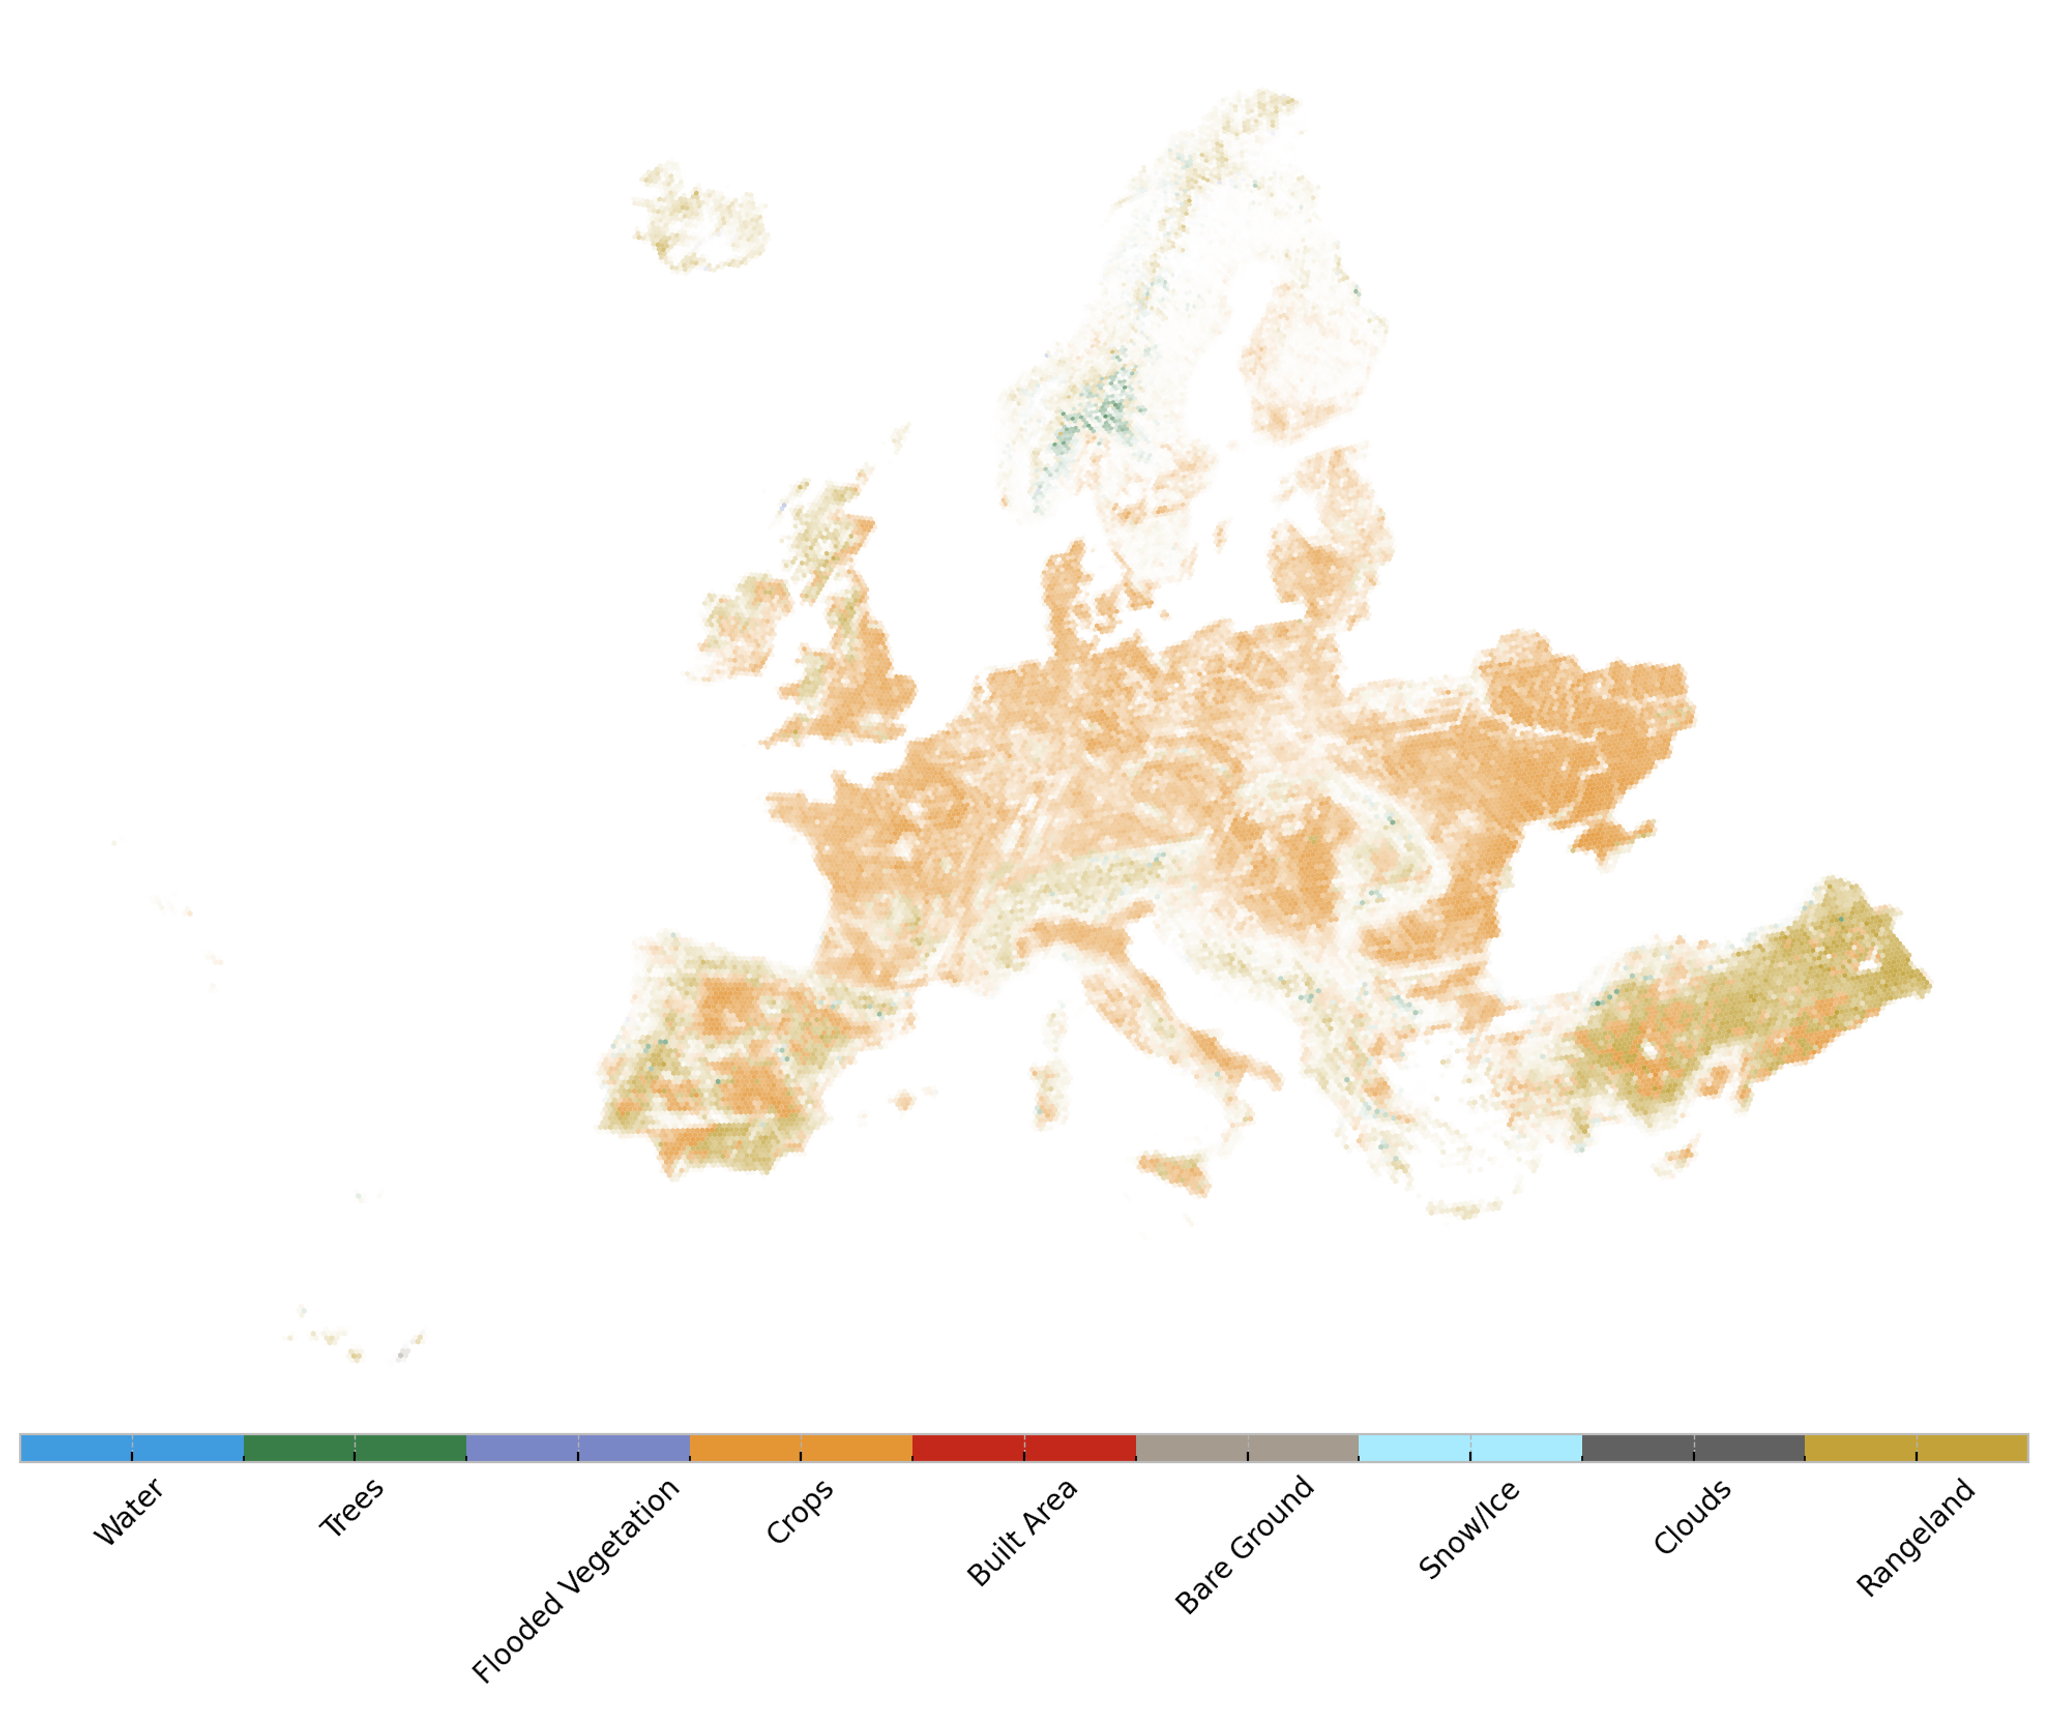
Figure 2: Majority LULC class per hexagon cell with the total field boundary coverage as the opacity channel.
Fields with >95% pixel coverage of a single LULC class were kept, leaving fields primarily in crops (68.1%), rangeland (25.8%), and built-up areas (1.9%). During visual check it was noticed that built-up areas were often misclassified but still represented agricultural fields.
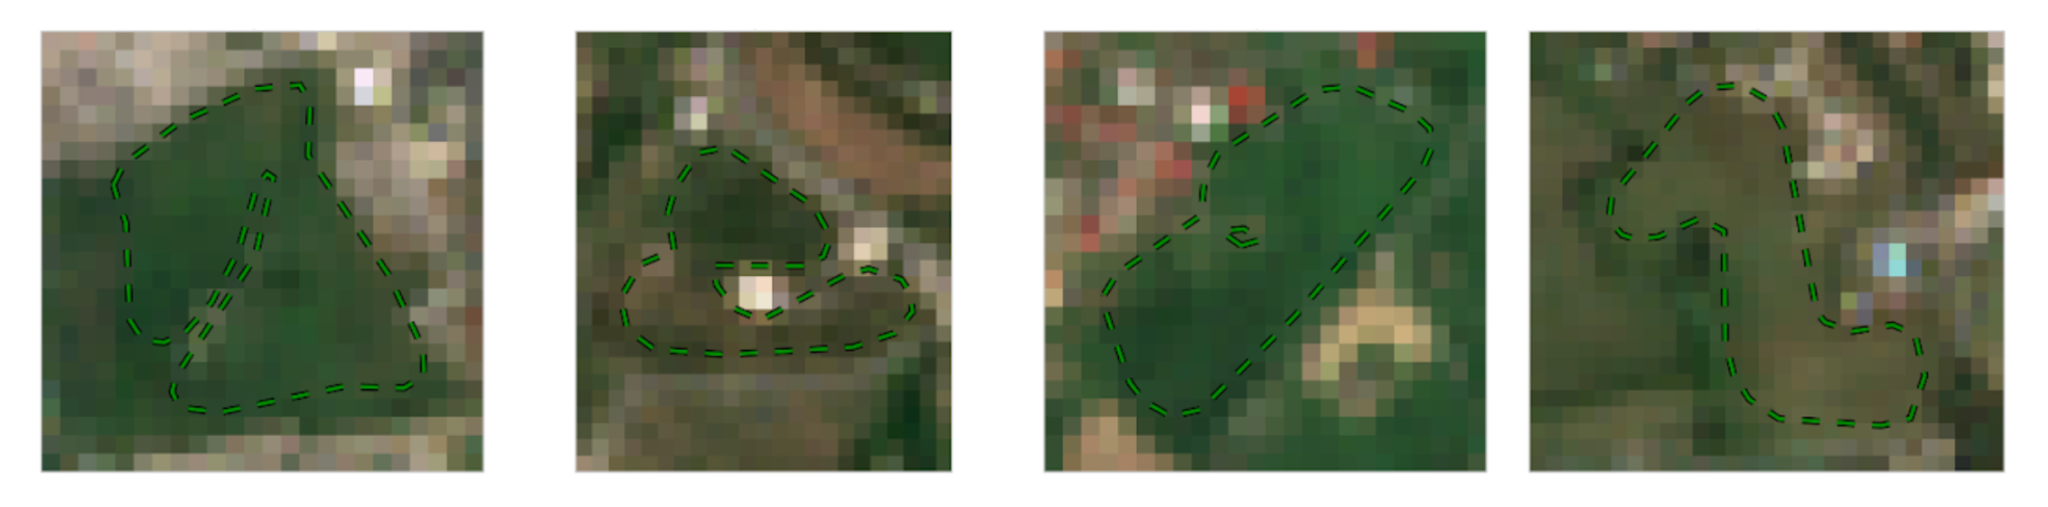
Figure 3: Fields with > 95% of pixels which belong to the built-up area LULC class, but seem to represent agricultural areas.
After this step, we retained ~55.3M fields, removing an additional 13% of the original data.
Polygon size- and complexity-based filter
Finally, we tried to get a handle on the more geometric properties of the field boundaries. We applied metrics that assessed the complexity of the polygons in terms of curvature, allowing us to remove outliers. The result was minimal data loss, with a total of 51,398,853 fields retained.
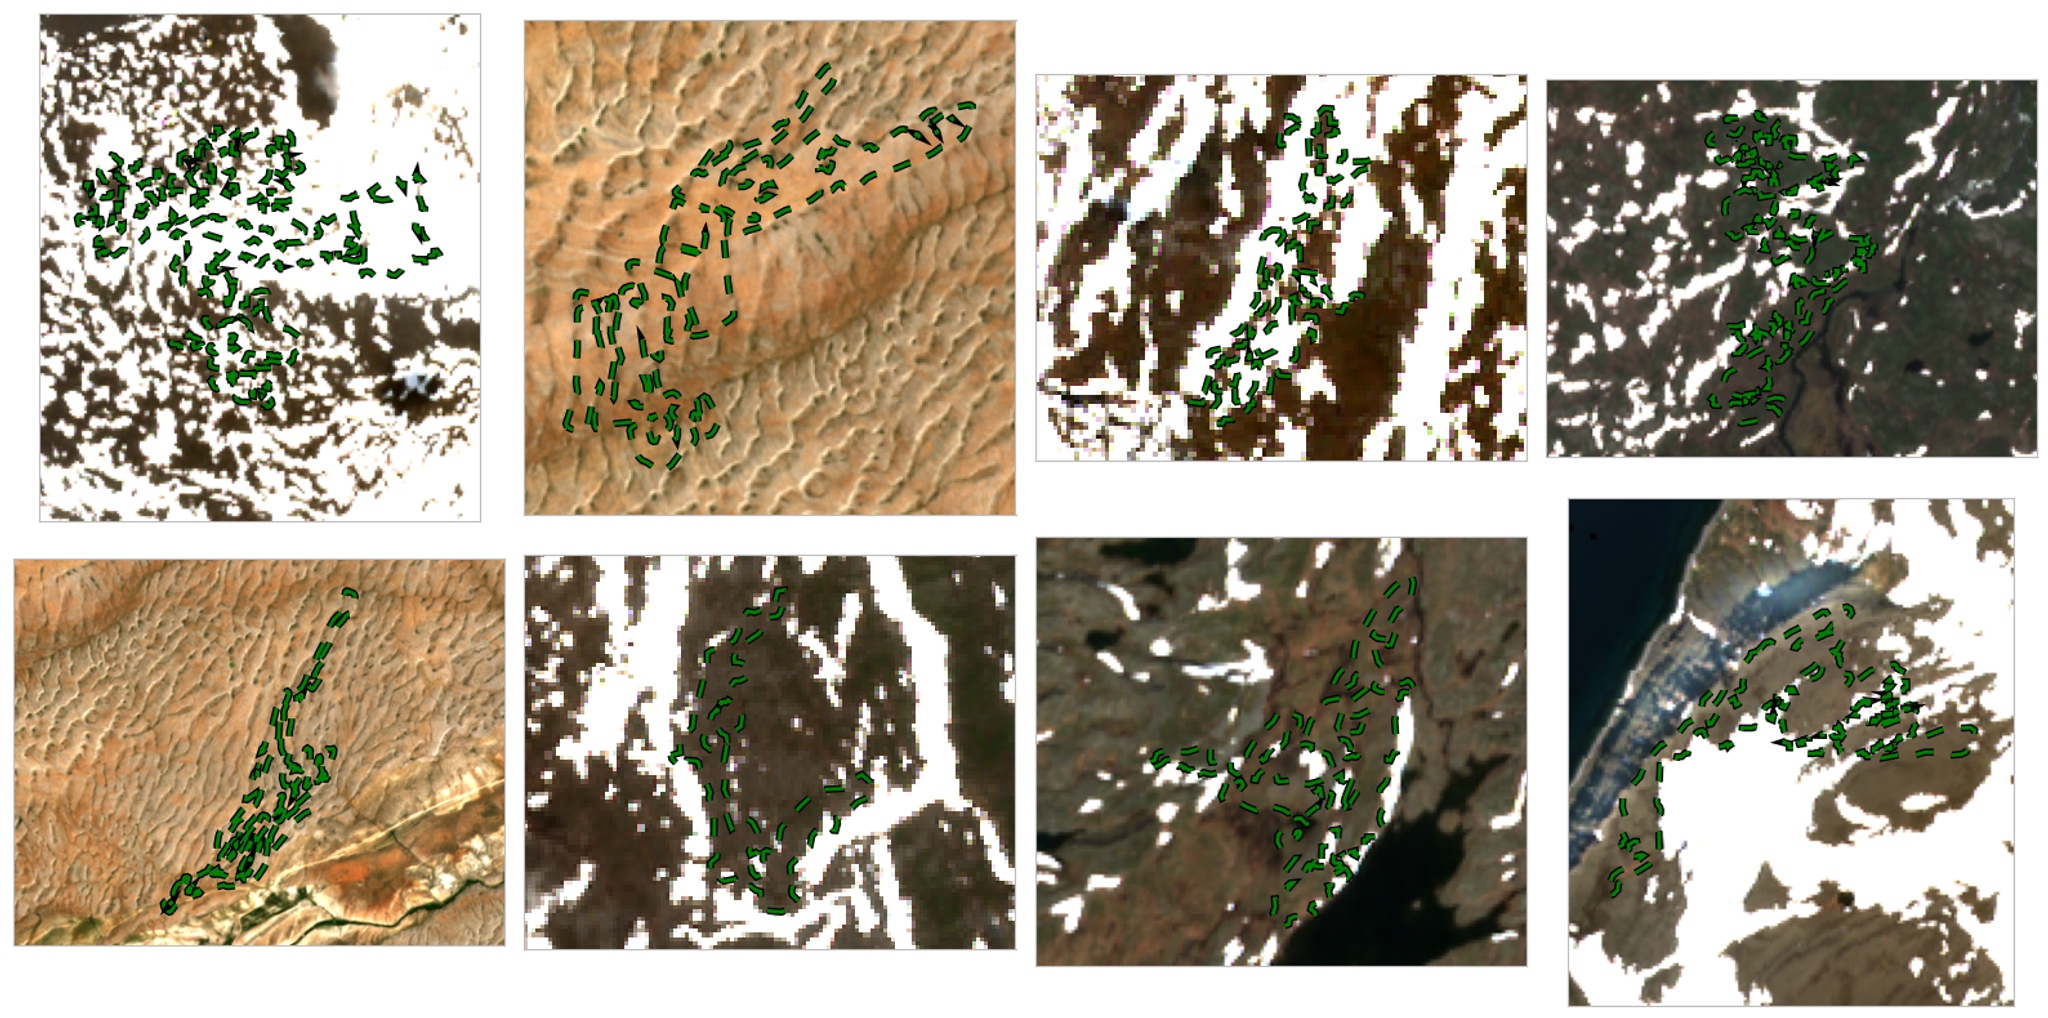
Figure 4: Field boundaries (green) removed because they are too complex to be validated.
Unlock New Possibilities
The OEMC Field Boundaries dataset provides an opportunity to access automated field boundaries at a large scale. By offering over 51 million agricultural fields across Europe, this dataset opens up new possibilities for research and decision-making in the agriculture sector.
We invite you to explore the dataset and consider how it could complement your own work. Whether you're developing agricultural technologies or conducting research, the OpenEM field boundaries data can offer insights that were previously difficult to obtain at this scale. If this dataset can support your work, we’d love to hear from you!
In our upcoming blog post, we’ll talk about crop classification built on top of the field boundary data. By linking field boundaries with crop type classification, we’re able to unlock valuable insights into agricultural practices. Stay tuned as we will dive into the technical details of how we performed crop classification.
Ready to Get Started
Connect with a member of our Sales team. We'll help you find the right products and pricing for your needs.