
Measuring the Bathtub Ring: Calculating Reservoir Surface Area Changes in the Colorado River Basin

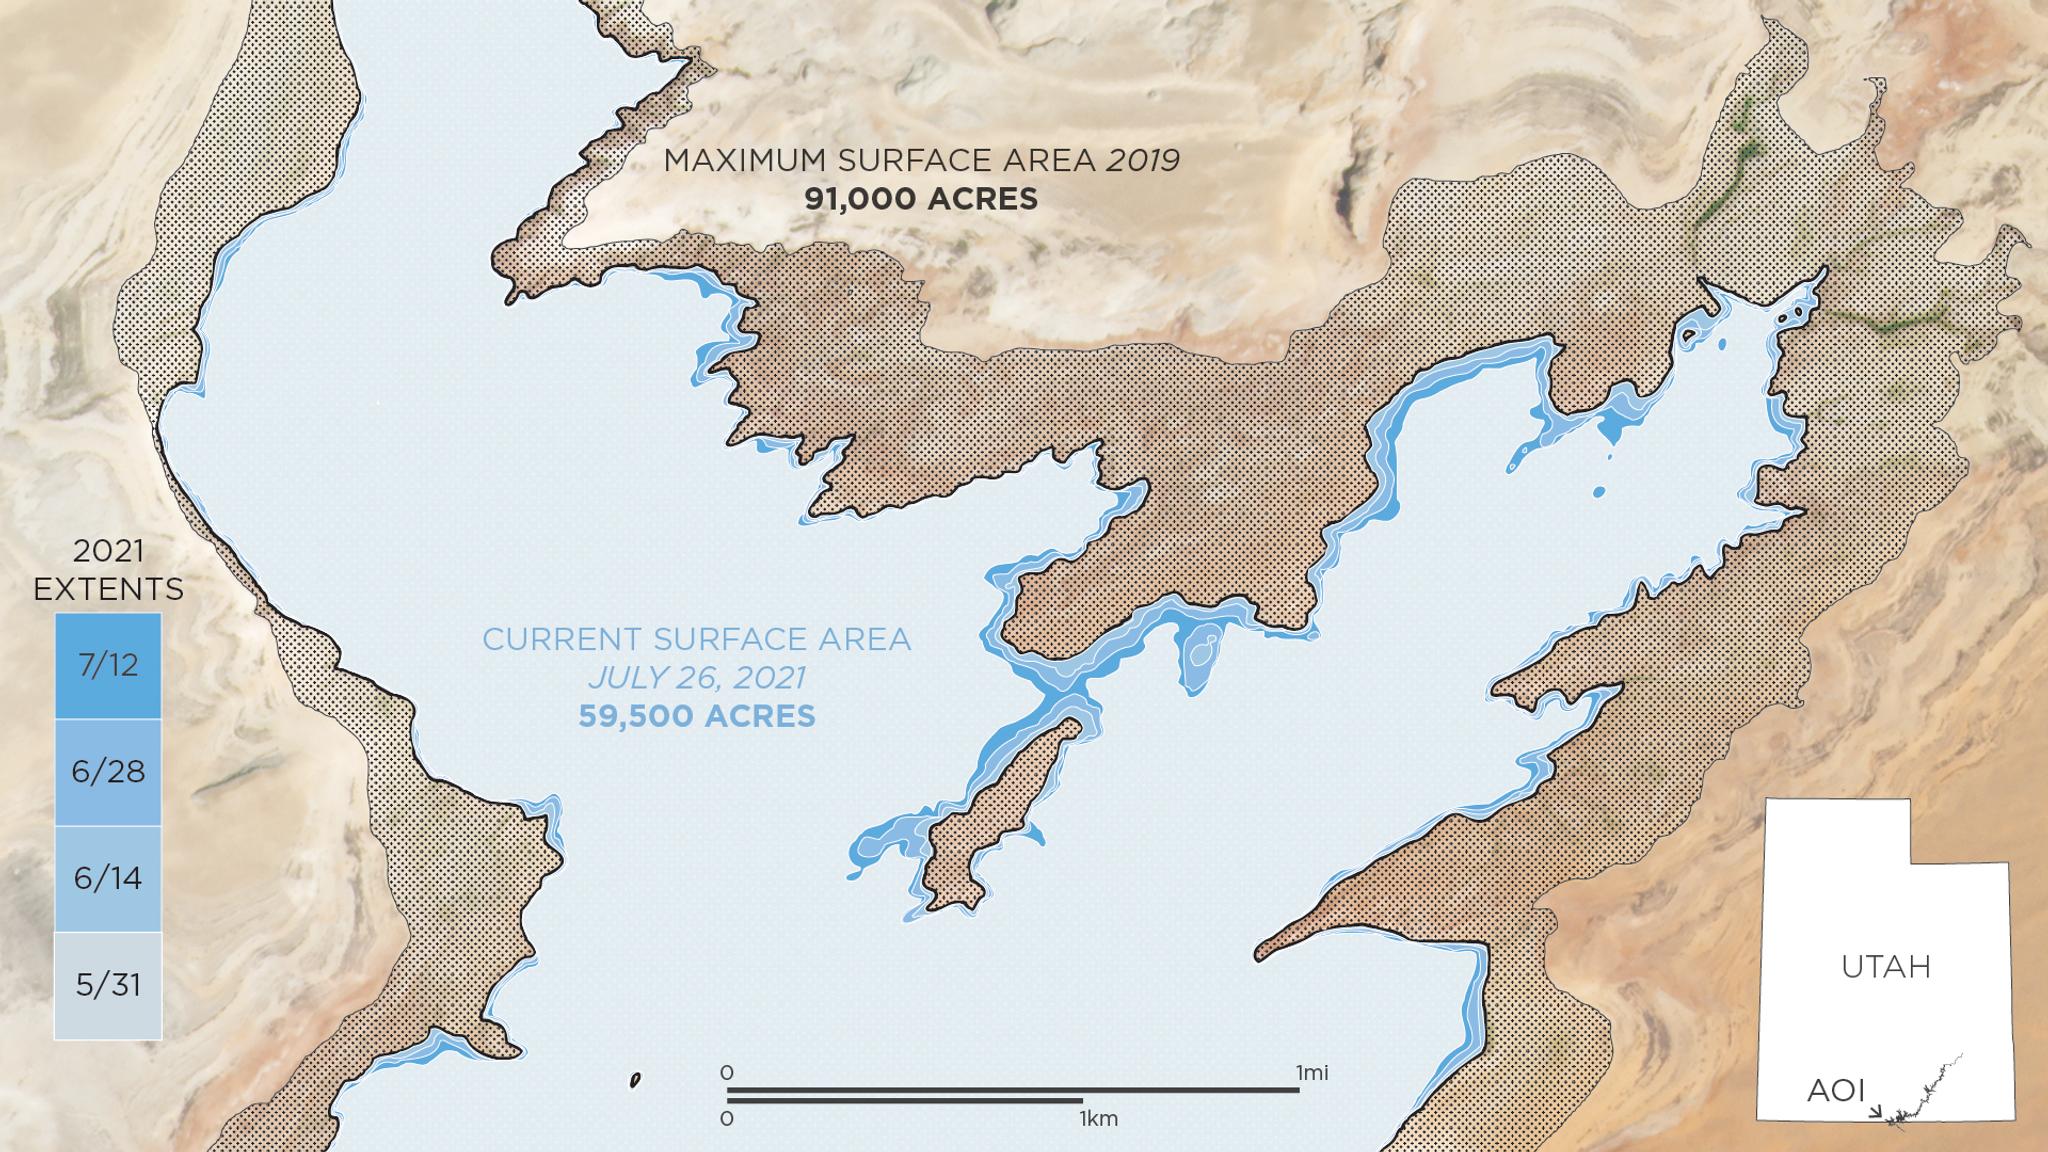
Graphics and Data Analysis By: Leanne Abraham On August 16th, 2021 the US Bureau of Reclamation declared an unprecedented water shortage for the Colorado River, a vital artery that winds through seven states in the western United States over 1,450 miles. From its inception in the Rocky Mountains to its drainage in the Gulf of California, the river generates electricity at multiple dams, supports the region’s extensive agricultural industry, and provides an essential water supply to roughly 40 million people. However, the current megadrought—a decades-long period of extreme dryness—has reduced the river’s system storage to 40% capacity and lowered its reservoirs to historic levels, prompting drastic government intervention. Quantifying the effects of drought is a critical step in monitoring their severity and providing the data necessary for regional authorities to act upon. Several indices exist for measuring hydrological drought, but a deficit of Earth-observation data has restricted their effectiveness. Planet’s remote sensing satellites can aid in calculating the surface area of inland water bodies, including reservoirs, at an unprecedented spatial and temporal scale, contributing to drought quantification that is repeatable globally and at scale. [caption id="attachment_147182" align="aligncenter" width="1920"]
Historical Context
How Can Planet Help
Creating a means of measuring changes in the surface area of reservoirs at sub-monthly intervals could help local authorities manage water resources and better our understanding of hydrological systems. Current measurements, however, are impeded by limited observation data and model uncertainties. High-resolution, high-cadence satellite imagery is uniquely positioned to fulfill this demand and complement the existing indices based on drought-impacted reservoirs. In order to track how the bureau’s diversions are impacting water supply in the four reservoirs, we incorporated public data sources such as the Global Reservoir and Dam Database (GRanD), in addition to our own daily PlanetScope 3m imagery. We then used a semi-supervised learning approach on the Google Cloud Platform to detect water and calculate the two-week median surface area of the four reservoirs. This classification was performed on each waterbody from March through August using data from 2019, 2020, and 2021.
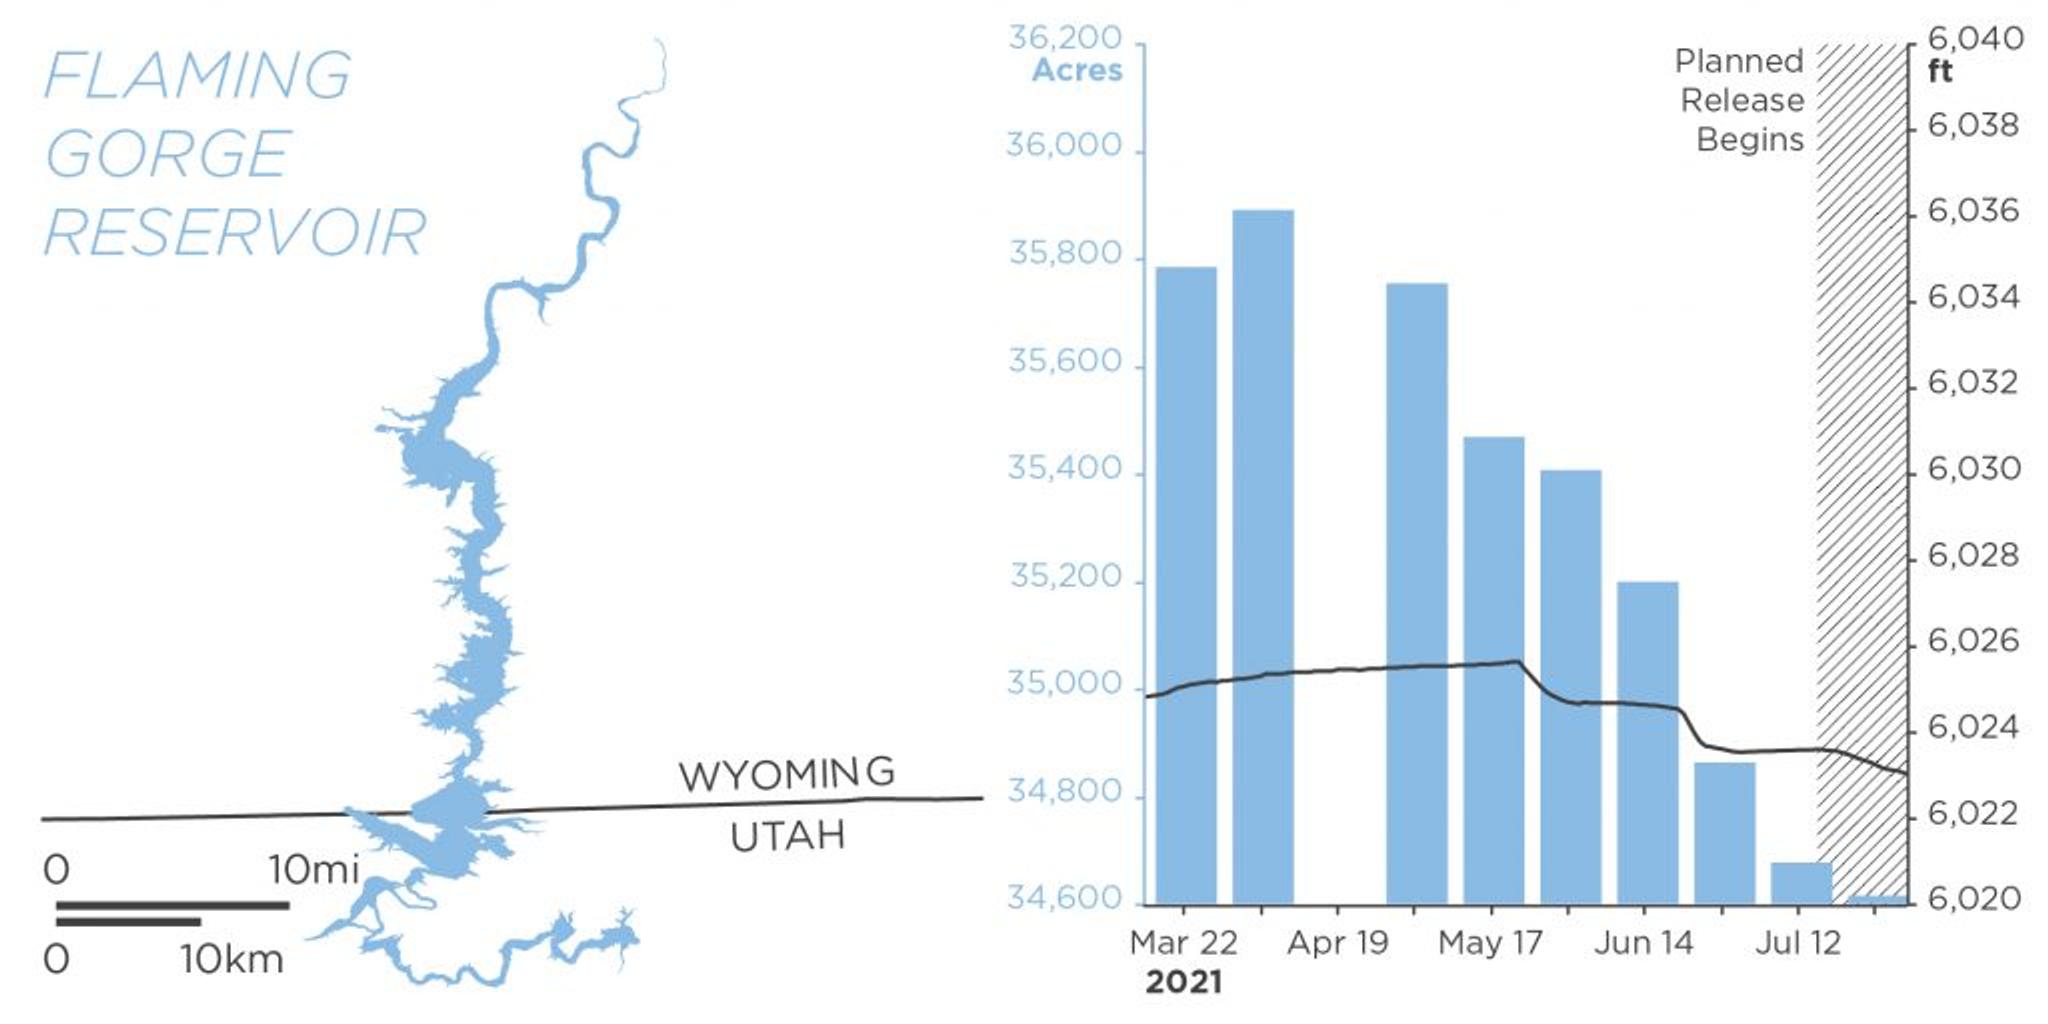
Flaming Gorge Reservoir, Wyoming and Utah
The first planned release from the Flaming Gorge Reservoir began on July 15, 2021 and is scheduled to continue through October with a planned release of 125 thousand acre-feet (kaf) of water. Despite relatively constant elevation levels up until this point, our surface area measurements for Flaming Gorge reflect a significant decrease in area, exposing land in the upper portion of the reservoir as the drought continues. [caption id="attachment_147167" align="aligncenter" width="1024"]
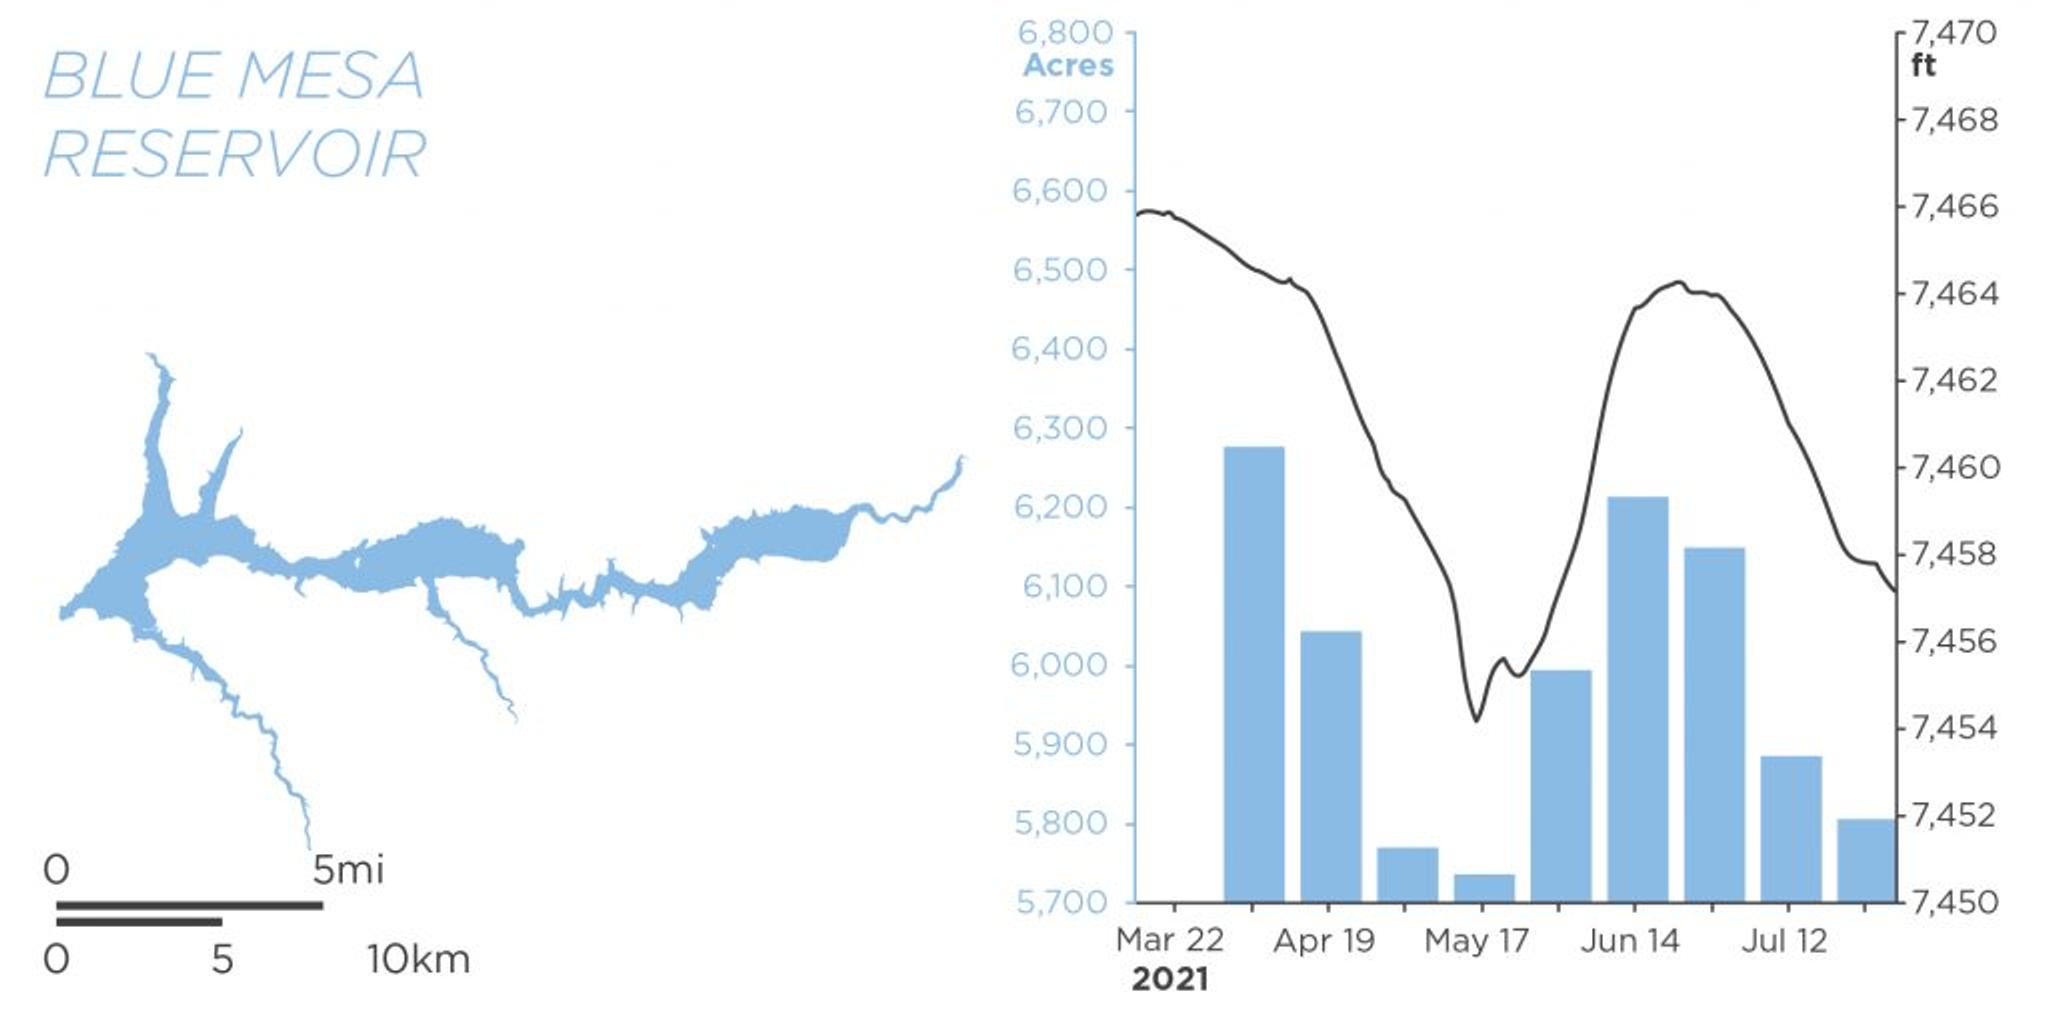
Blue Mesa Reservoir, Colorado
Releases from Blue Mesa are scheduled to begin in August 2021 and continue through October, with a planned release of 36 kaf. [caption id="attachment_147164" align="aligncenter" width="1024"]
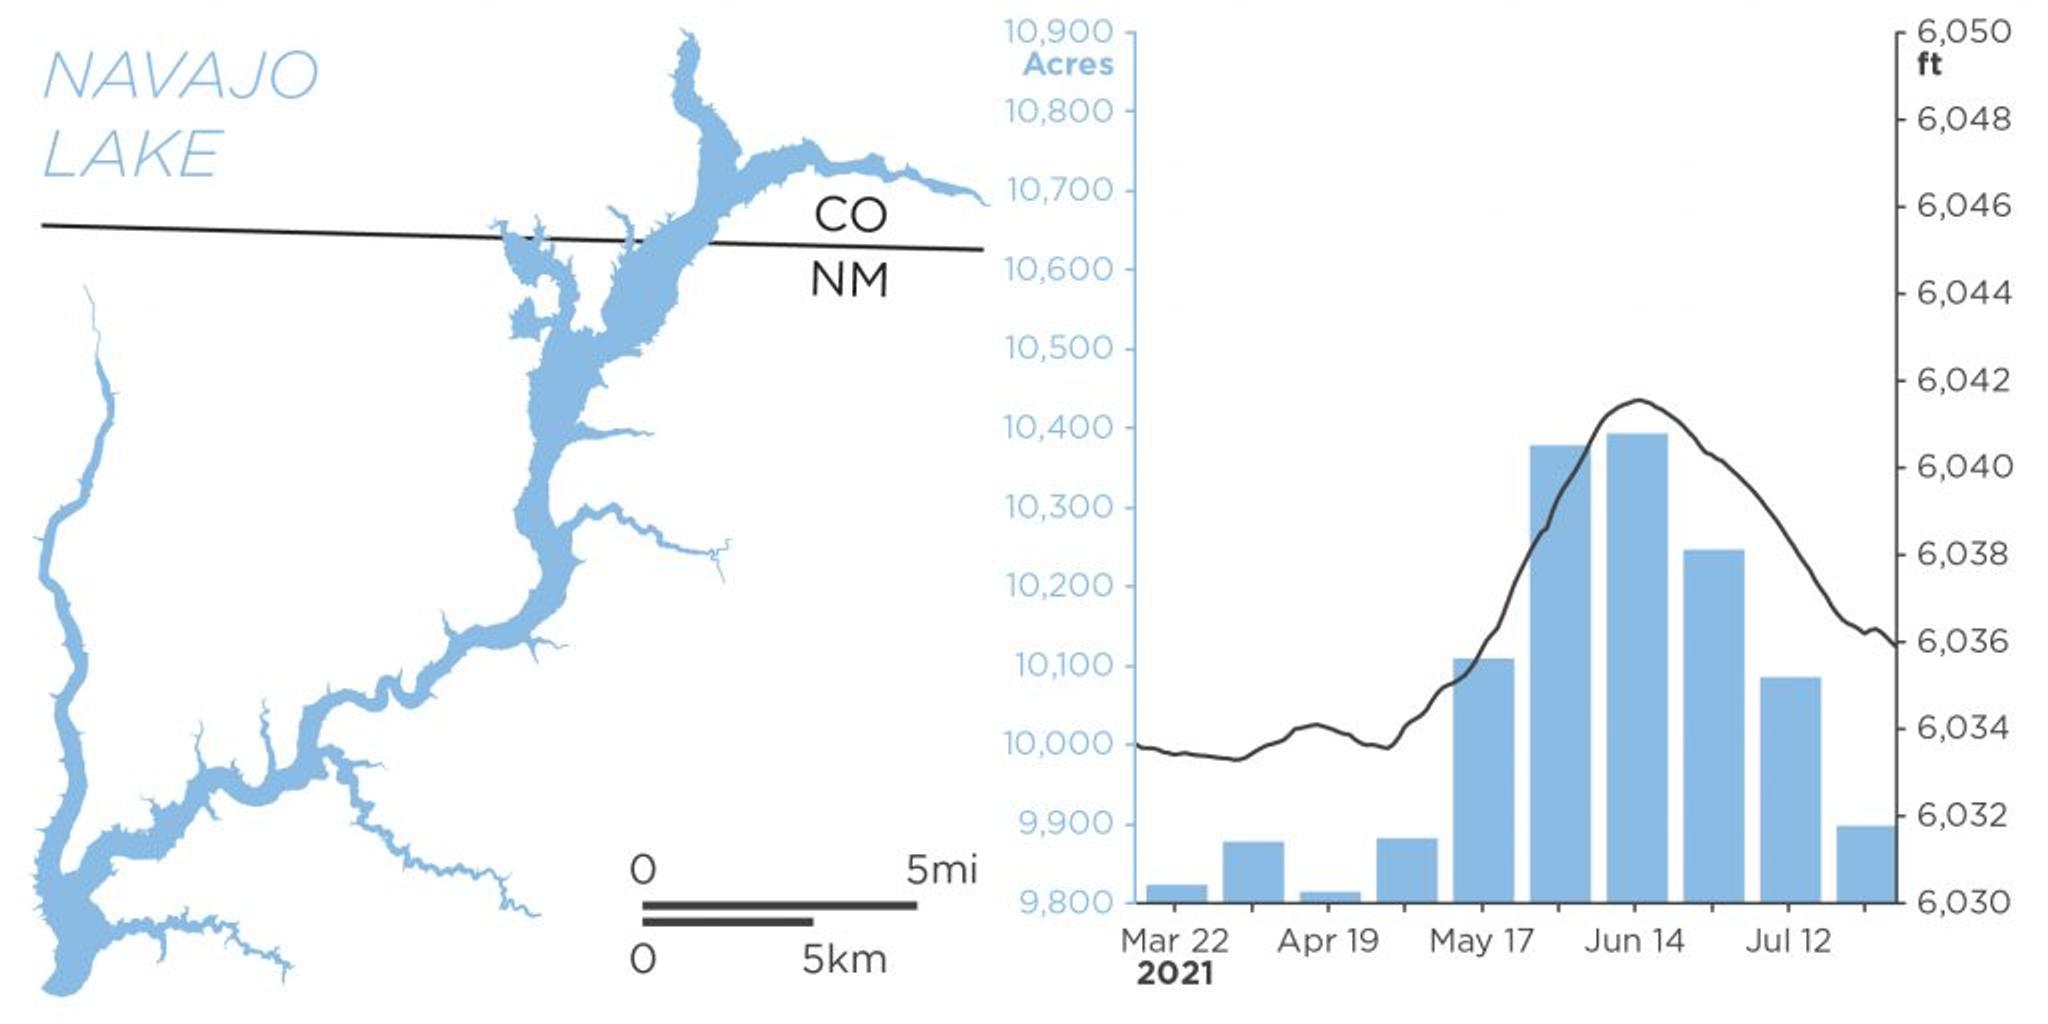
Navajo Lake, New Mexico
A 20 kaf planned release from Navajo Lake is scheduled for November and December 2021. [caption id="attachment_147159" align="aligncenter" width="1024"]
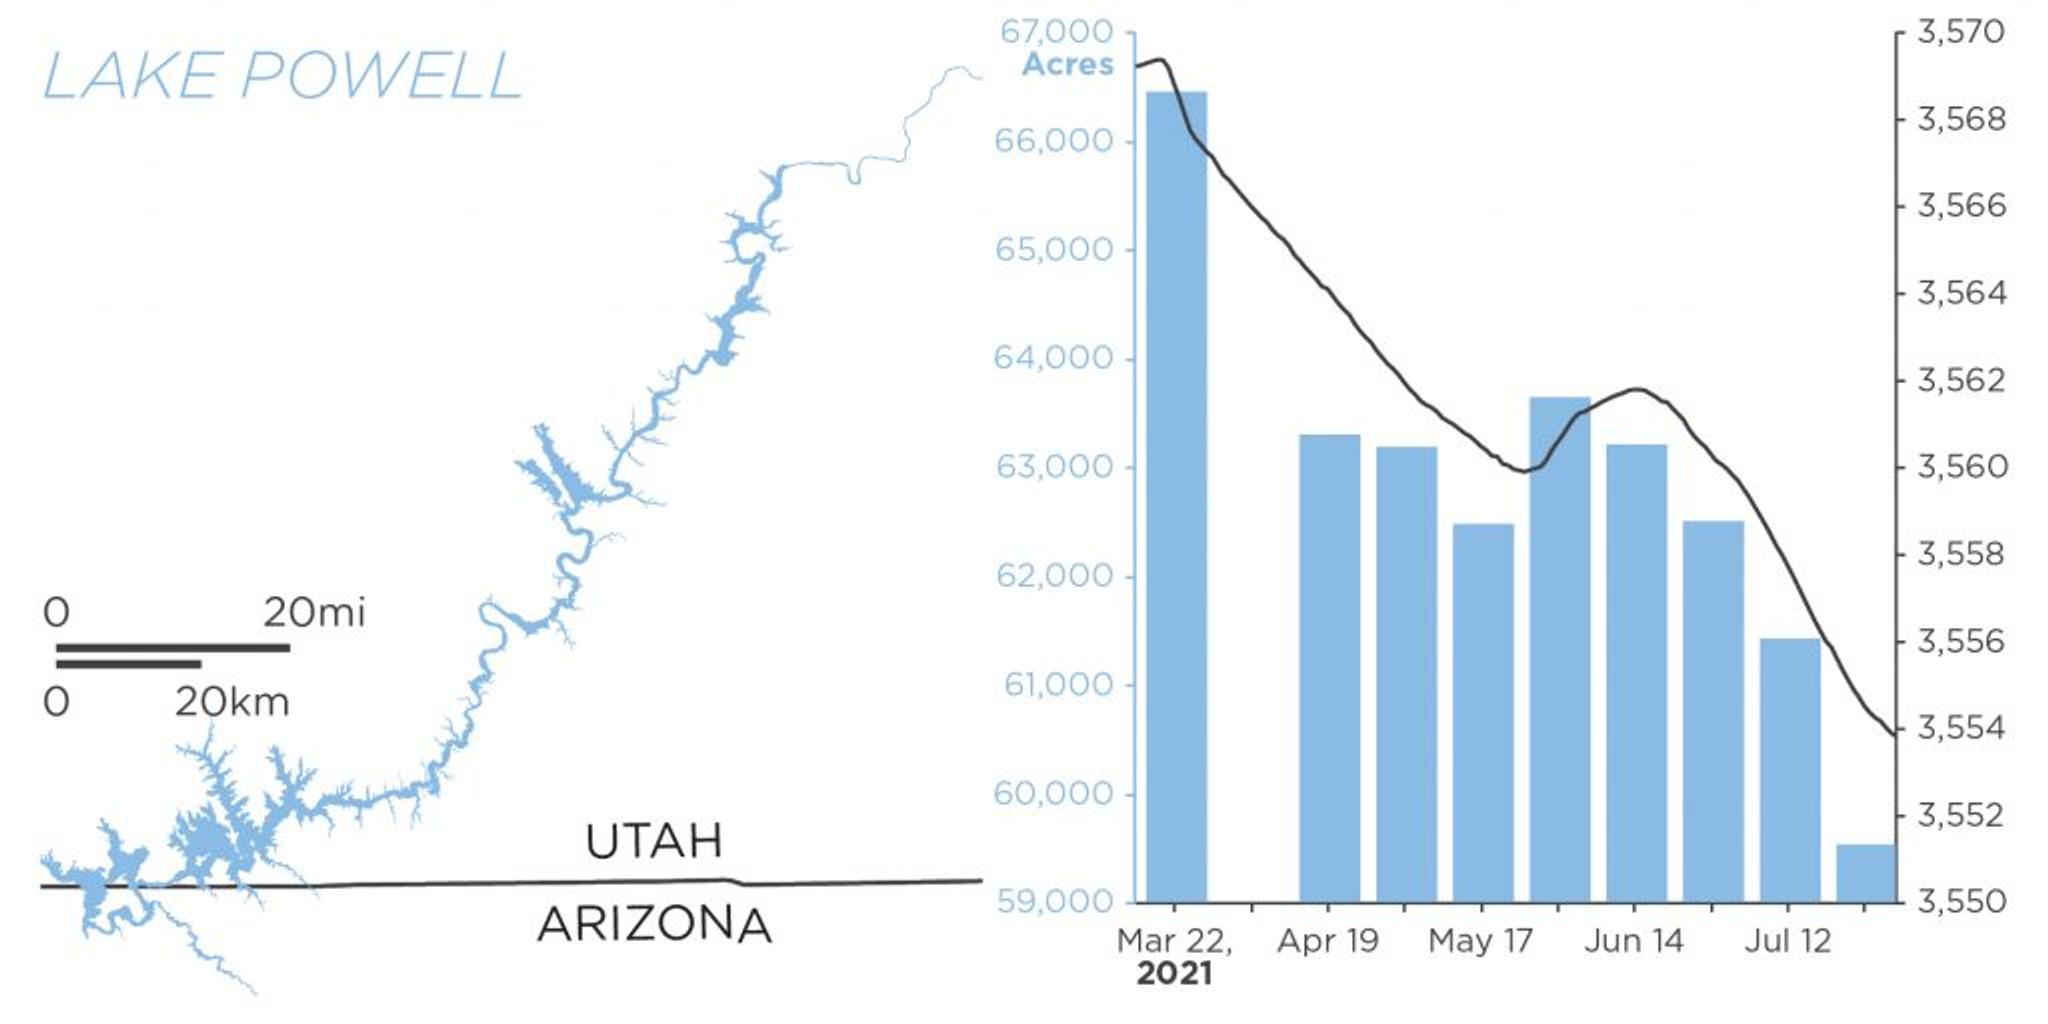
Lake Powell, Utah and Arizona
Since March, Lake Powell has had two periods of significant loss. The reservoir lost water more rapidly in the second decrease during the warm summer months, indicated by a steeper slope in elevation level. As water is diverted into Lake Powell over the following months we expect to see a relative increase in both elevation and surface area. [caption id="attachment_147165" align="aligncenter" width="1024"]
Additional Data Sources
Reservoir Elevation Data Source: Bureau of Reclamation Planet maximum reservoir extents clipped using the National Hydrology Dataset
Ready to Get Started
Connect with a member of our Sales team. We'll help you find the right products and pricing for your needs.