Why Dense Satellite Time Series Deliver More Trustworthy Insight

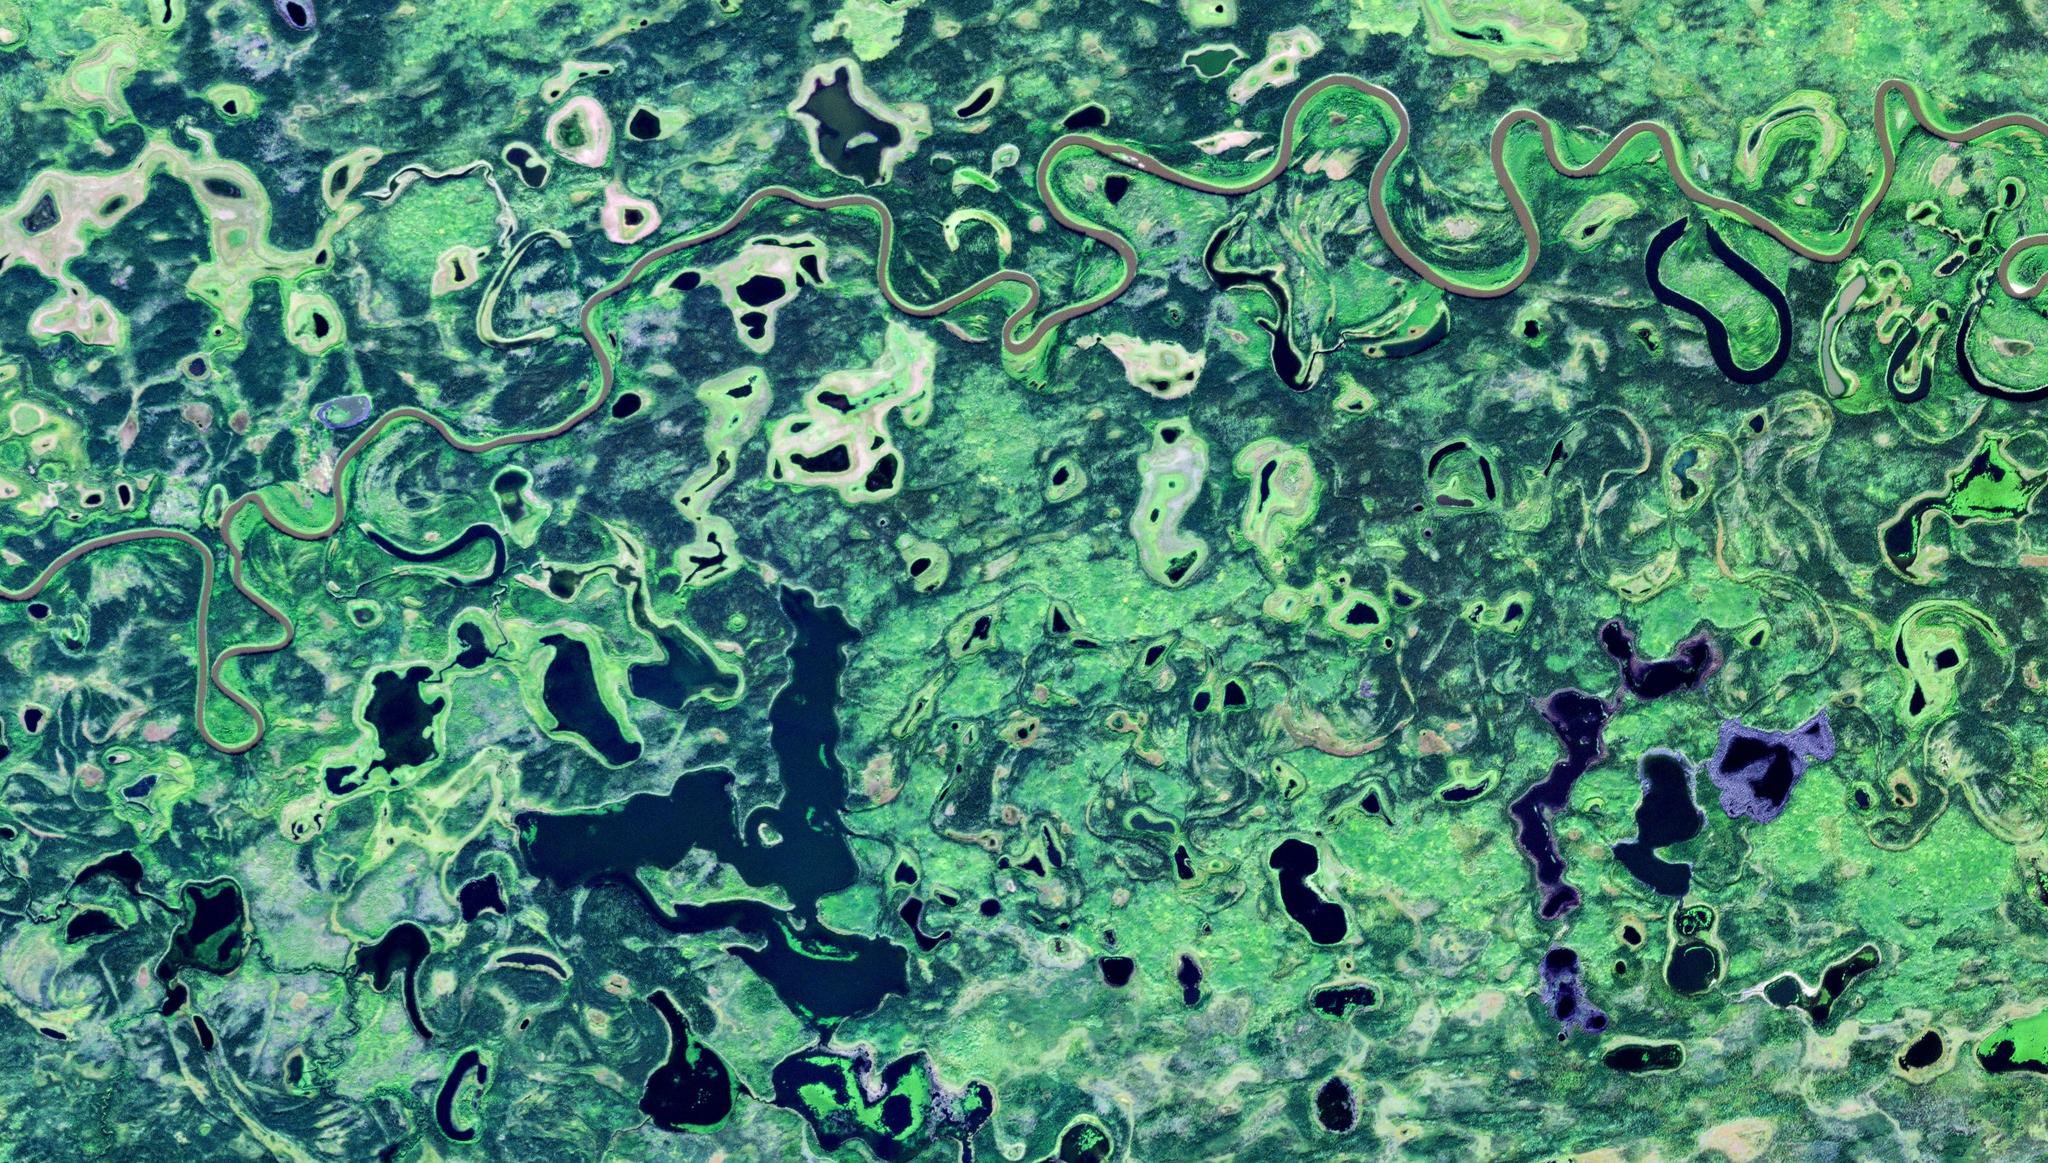
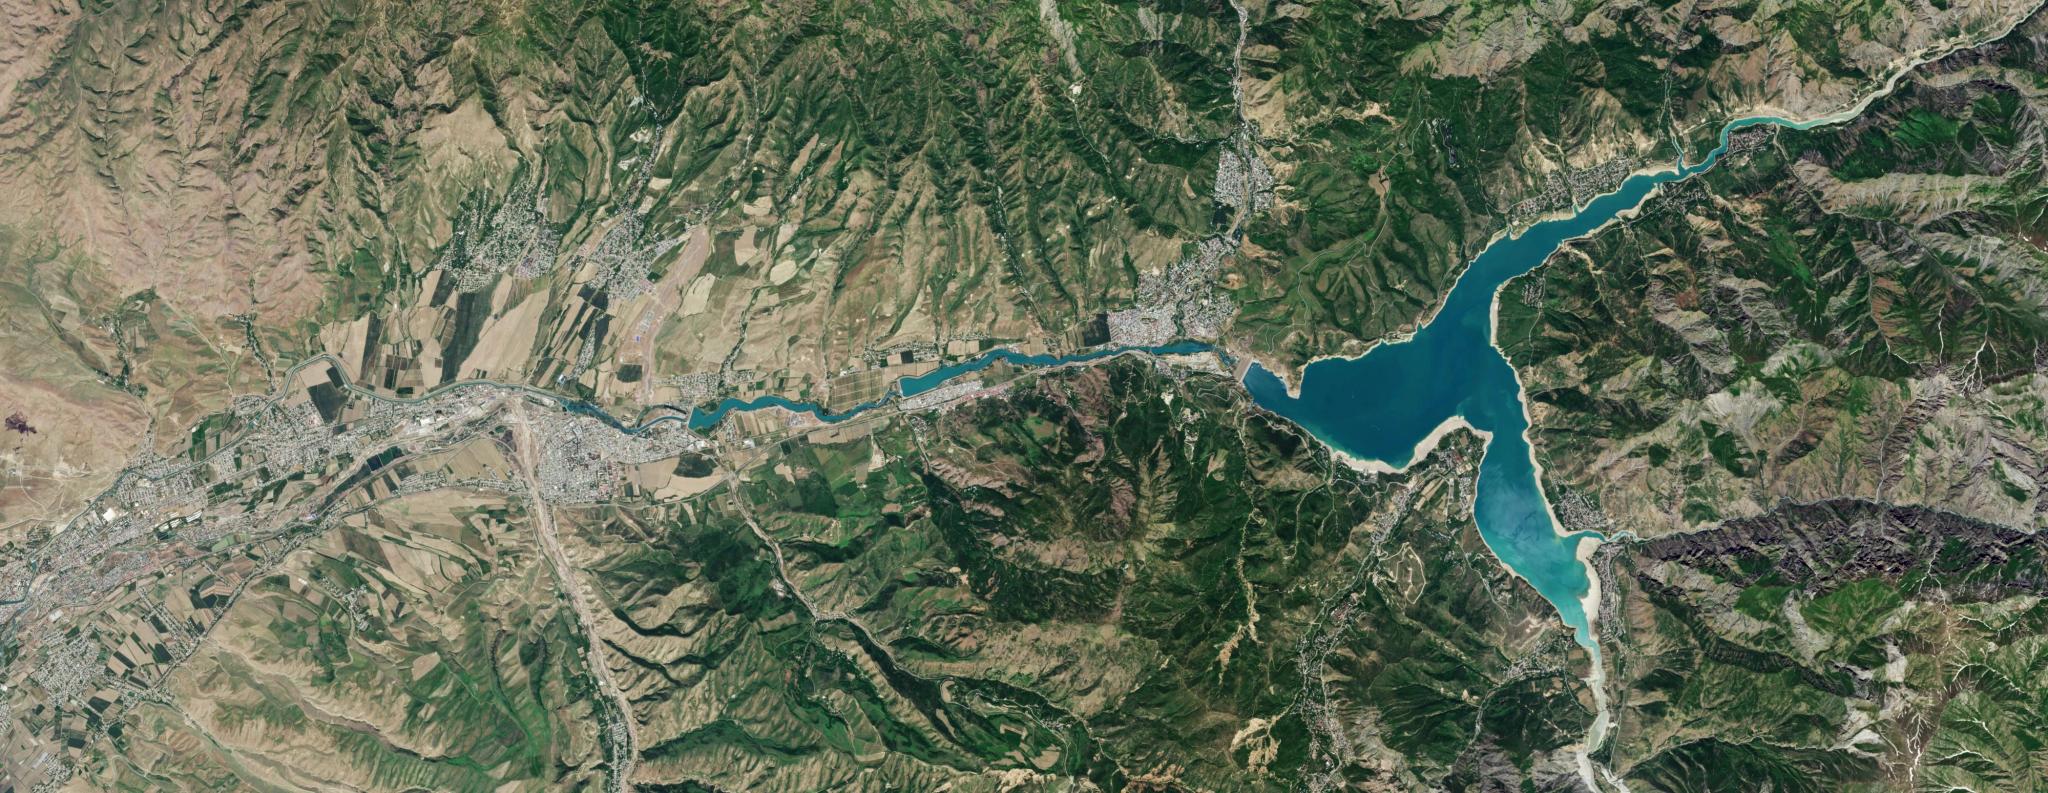
PlanetScope image of small rivers and lakes near Yukon Flats in Alaska, captured August 26, 2024. © Planet Labs 2022. All rights reserved.
TechAt the heart of many satellite driven monitoring programs there is a common misperception, underpinned by a seemingly simple question: How often do we need satellite images over our sites to solve our business problem?
An obvious response might be to only image at the frequency that matches your reporting cadence. So for a quarterly yield forecast report, one might think quarterly imagery is sufficient. Or a monthly construction site development review might require a monthly scene. It sounds reasonable, yet it can be a very costly mistake.
How often you report on something and how often you observe the phenomenon of interest are separate questions. Conflating them weakens the confidence of every metric that follows, because without enough context, you risk arriving at conclusions that simply aren’t accurate. This can be especially true if analysts, including those at government agencies, rely solely on open-source low frequency satellite data.
Why a Single Image Is a Guess
Think of a satellite image as one frame from a film. It can be sharp, but on its own it can't tell you if what you're seeing is typical, unusual, just starting, or nearly finished. The Earth's surface is incredibly dynamic, even more than most people realize. Without context, a crop field that looks green in one Landsat scene might be at peak biomass, recovering from drought stress, or newly weedy after a failed planting. A water body that looks full might have been drawn down and refilled between passes. A forest canopy that looks intact might have been selectively logged and partly re-greened in the gap between clear views.
Signal processing offers a simple way to get the context needed to understand what you see in a single frame. To reliably capture a change, a rule of thumb is that you need to sample it at least twice as often as it happens. If a process unfolds over two weeks, 28 days of data is needed. If a rangeland greens up and dries down within a month of a short rainy season, an analyst needs data from two weeks before and after this activity to get a full and accurate picture of change.
Clouds Make the Gap Worse Than the Spec Sheet Suggests
The nominal revisit rate of public missions can result in critical blind spots. Landsat 8 and 9 together revisit every eight days, and the Sentinel-2 constellation roughly every five days at mid-latitudes. But nearly two-thirds of the planet is under cloud at any moment. A global analysis of Landsat ETM+ data by Ju and Roy showed how sharply clouds cut usable acquisitions, especially in the tropics and in high-latitude growing seasons. This is where the monitoring of forests, peatlands, and agriculture is most needed. A nominal eight-day revisit can easily turn into a clear view every month or two, landing at unpredictable times.
Near-daily constellations like PlanetScope® change the odds. With more attempts, you are much more likely to catch the brief, clear windows between weather systems. The benefit isn't just more images — it’s a time series with fewer long, arbitrary gaps, and that is what makes an analysis curve reliable.
What the Studies Show
Academic literature is rife with examples of studies that demonstrate why high-frequency data is needed to effectively monitor and understand change that matters to government agencies.
In semi-arid Kenya, Cheng and colleagues (2020) compared PlanetScope and Sentinel-2 for mapping the short, rain-driven vegetation cycles of a rangeland. At validation sites, both provided acceptable phenology estimates. But across the full landscape, the PlanetScope results showed noticeably fewer spatial artefacts. The authors attributed this directly to its higher observation frequency, which "becomes critical during periods of persistent cloud cover." The 3 meter data could also separate the green-up timing of individual trees from the surrounding grass.
Moon, Richardson, and Friedl (2021) ran a careful multi-site comparison of PlanetScope, Harmonized Landsat–Sentinel-2 (HLS), and ground-based PhenoCams. On average, the sources agreed well. But most of the spatial variation in phenology captured by PlanetScope happened below the resolution of HLS. In other words, moderate-resolution sensors capture the average and miss the within-pixel story where much of the real management detail lives.
In Alaska's Yukon Flats, Cooley and colleagues (2017) used near-daily Planet imagery to track 268 lakes through a single summer. Water extent matched very high-resolution reference imagery to within about 11%. The dense series showed that a quarter of lakes rose and fell with river discharge, half steadily contracted, and a quarter stayed stable. Behaviour that varied at this scale and pace would be nearly invisible in a handful of cloud-limited Landsat scenes.
For forest disturbance, Francini and colleagues (2020) built a near-real-time alert system in Tuscany that updates every time a new PlanetScope image arrives. It achieved 86% user's accuracy and 92% producer's accuracy. Its area estimate of changed forest fell within one percent of a full census.
And in agriculture, Sadeh and colleagues (2021) fused PlanetScope with Sentinel-2 to produce daily 3 meter estimates of wheat leaf area index. Checked against field measurements in Australia and Israel, the estimates reached an R² of 0.94 without any ground calibration — which wouldn’t be possible with Sentinel-2 data alone.
Loading Video...
Comparison of PlanetScope and Sentinel-2 coverage over the Bath County Pumped Storage Station in Virginia, from October 2, 2025, through October 9, 2025. The higher cadence of the PlanetScope imagery reveals changes in the water levels of the reservoirs that aren't captured in the Sentinel-2 images.
A Balanced View Strengthens the Case
This isn't an argument that Landsat or Sentinel-2 are obsolete. They are the radiometric backbone of the field: well calibrated, backed by a decades-long archive and open-source access. Several of the studies above note that CubeSat constellations have real calibration inconsistencies between individual satellites, which is why cubesat constellations often cross-calibrate to these scientific missions.
The strongest results however often come from fusing them, using Sentinel-2 or Landsat for radiometric consistency and PlanetScope for temporal density and spatial detail. The point is that for anything dynamic, sparse sampling on its own leaves a confidence gap that no amount of clever modelling can fully close.
Separate the Observing From the Reporting
The practical lesson for agencies monitoring natural resources or remote assets is clear. Report at whatever cadence your decisions need: weekly, monthly, quarterly, or annually. But build those reports on the densest, longest time series you can get.
A quarterly carbon stock estimate built from ninety days of near-daily observations isn't just more detailed than one built from two clear scenes; it is statistically a different kind of claim. It can separate trend from noise, tell a real disturbance from a cloud shadow, date an event instead of just noticing it happened, and put honest error bars on the result.
The summary of insights from satellite imagery can be simple, but the evidence under it shouldn't be thin. Although higher cadence EO data may cost more than open source imagery, in my experience as an EO business solutions developer, the cost is often higher when decisions are made on less reliable data.
If you’re interested in learning more about how high-frequency Planet imagery can accelerate accurate, data-driven decision-making at your agency, download our e-book, Driving Program and Policy Effectiveness With Planet: Civil Government.