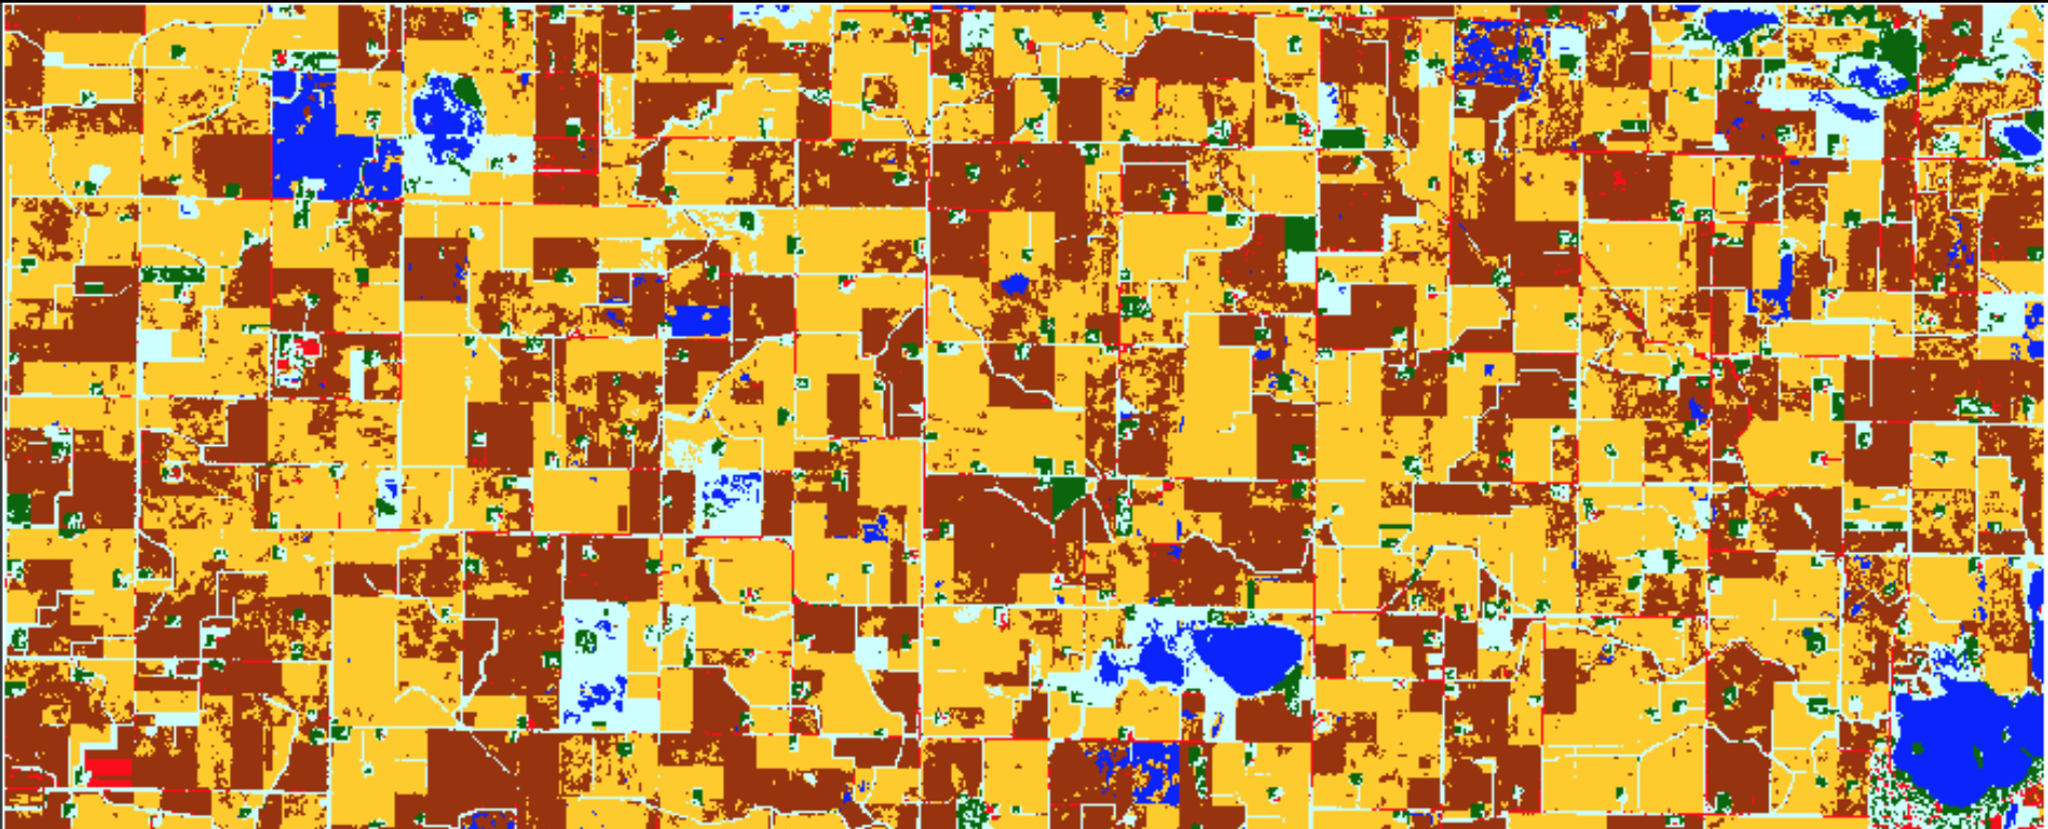
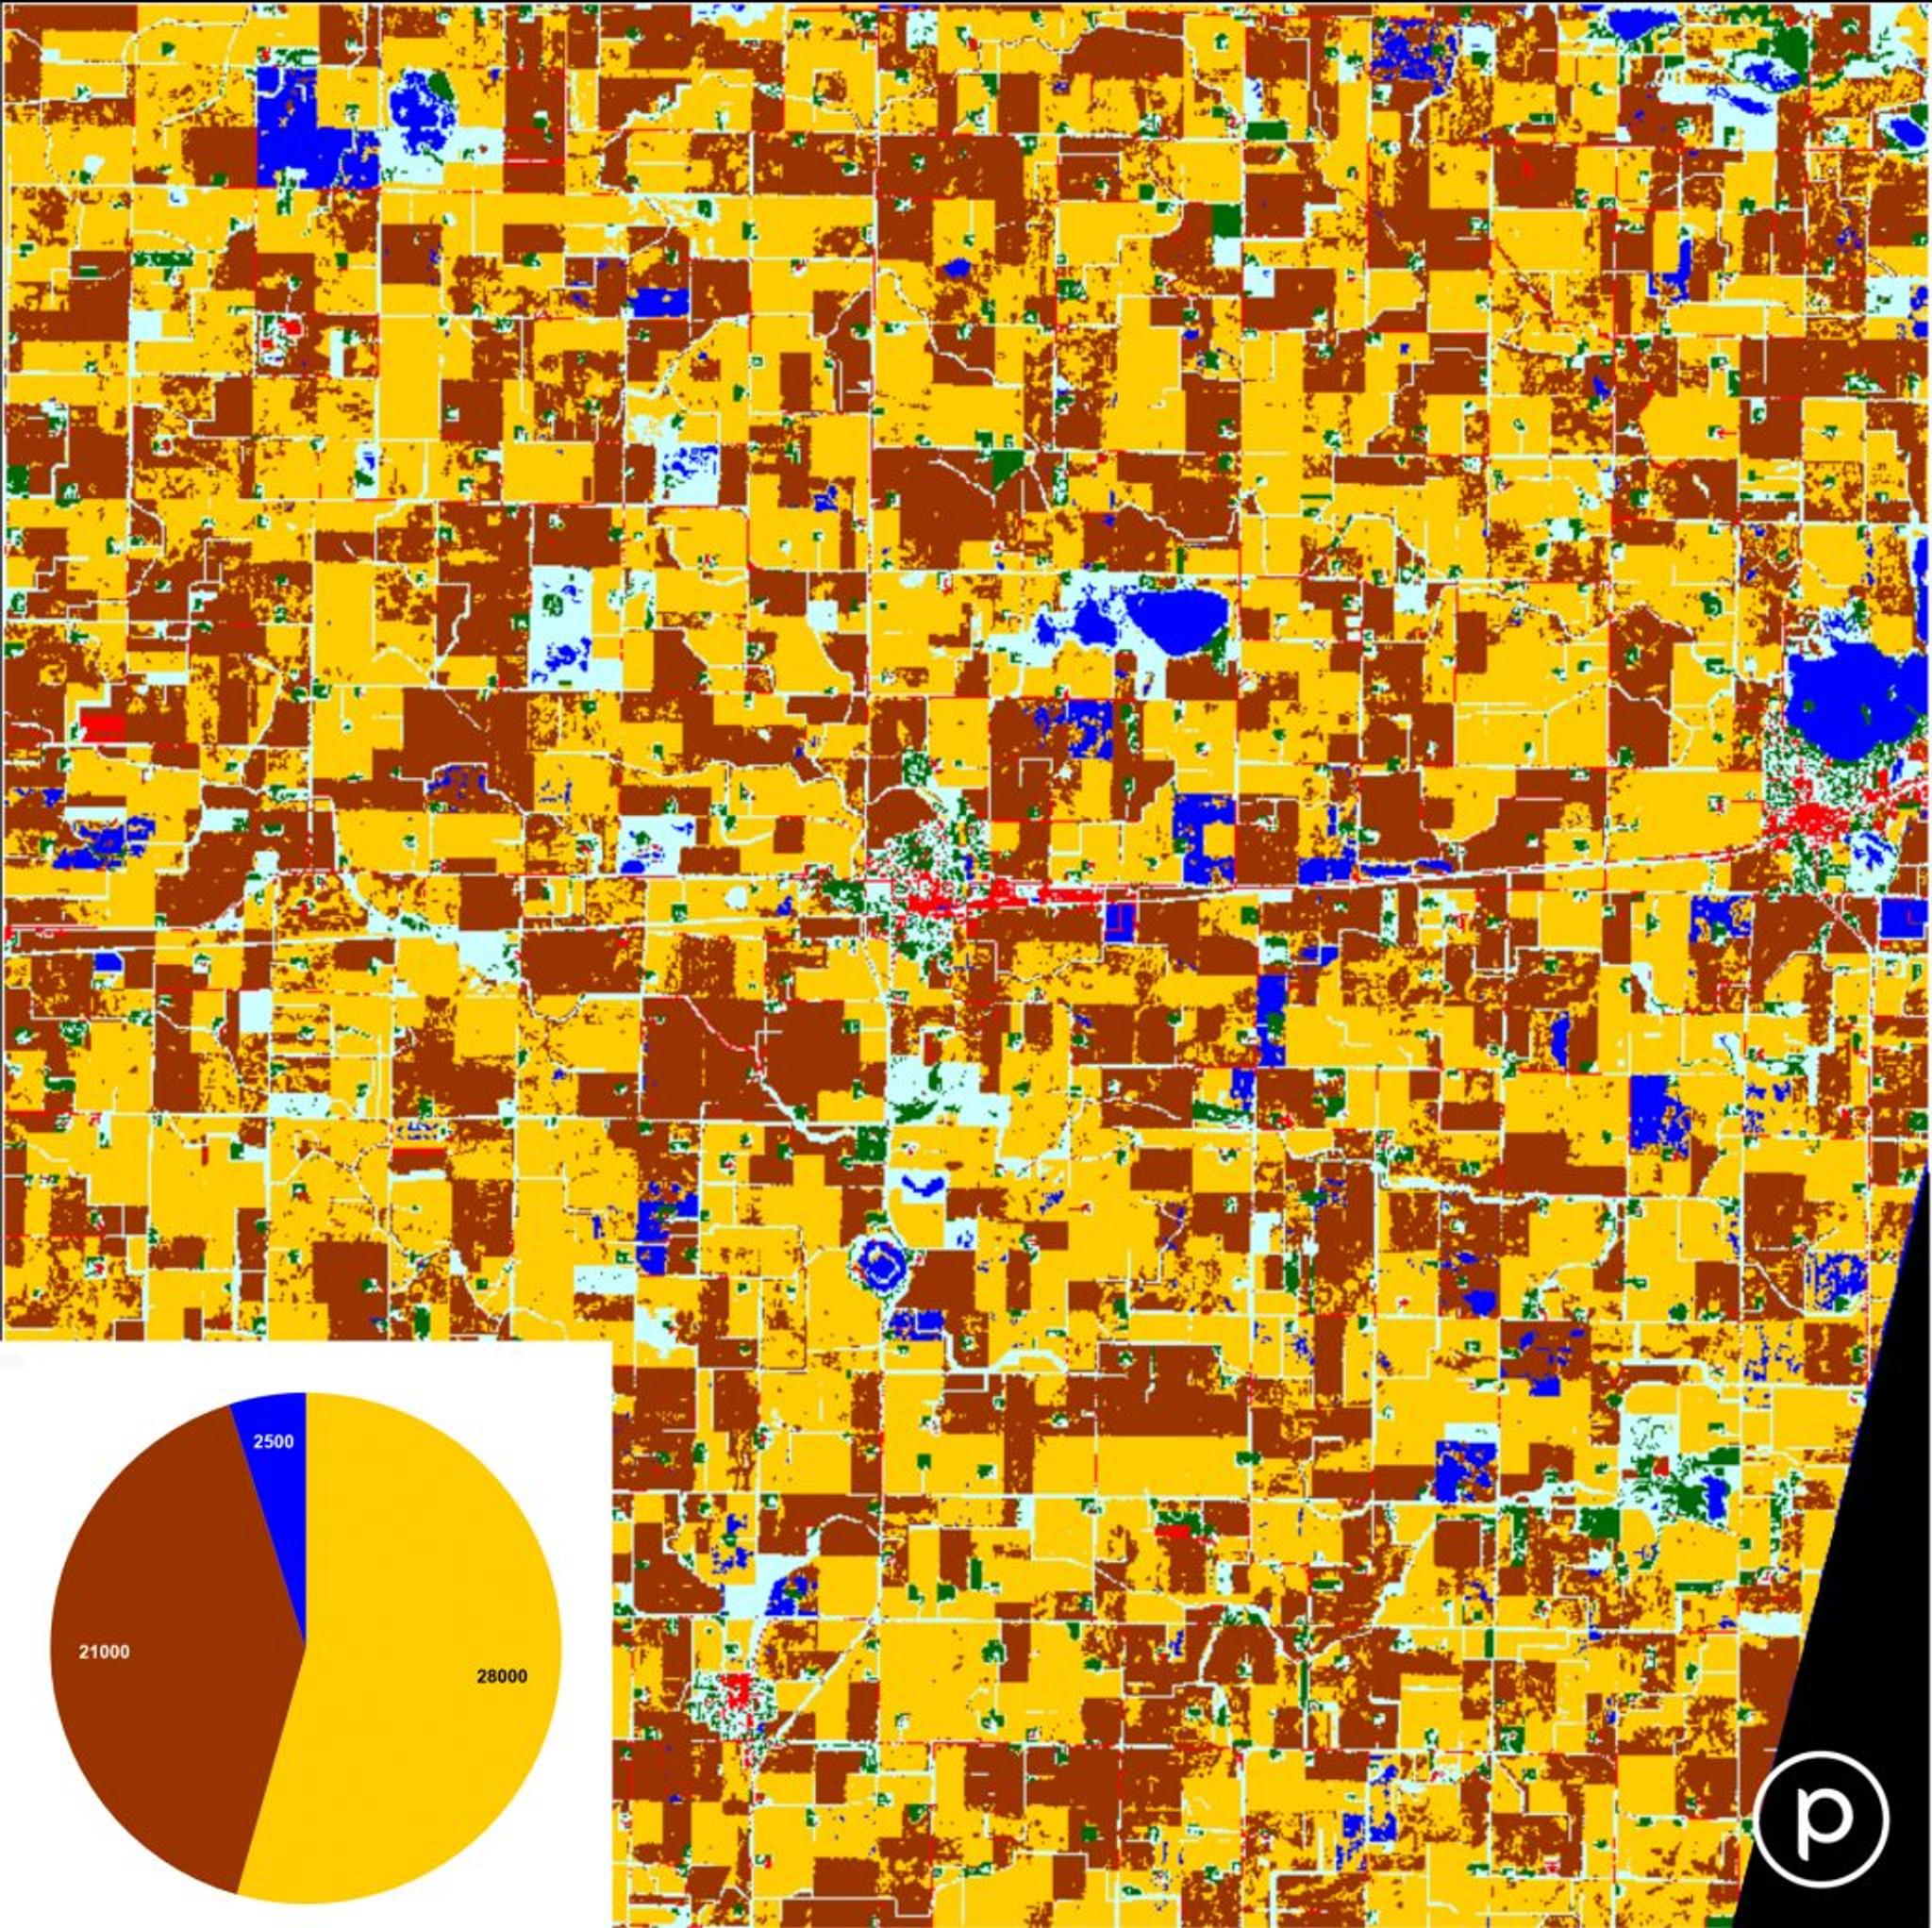
A land cover classification map produced of farmlands in Rolfe, Iowa with corn represented in yellow, soy in brown, water in blue, and infrastructure in red © 2017, Planet Labs Inc. All Rights Reserved.
AUTHOR PROFILE Erik Zillmann
Curious Planeteer working to make the Earth's changes visible, accessible and actionable.

Spoiler Alert! Satellite Data Offers Commodities Traders Early View of Crop Acreage & Yield

Stories

No one likes a spoiler alert – unless it makes or saves them money. When it comes to agriculture, a well-timed spoiler alert about how crops are performing is welcomed by farmers and commodity traders alike. For farmers, the ability to make detailed predictions on crop growth and yields is critical for their business. For commodity traders, it’s like getting insider information on the market. This is particularly valuable at a time when the major commodities traders are facing slimmer margins with the rise of digitization.

One way commodity traders make predictions is by measuring crop acreage, or the number of acres planted. This is critical information for estimating yields on a regional and country-wide level. The USDA publishes crop acreage reports annually, but these come at a date late in the growing season. Alternate data sources, like Landsat satellites or drones, to get ahead of the USDA can be too infrequent, low resolution, expensive, or limited in geographic reach.

Planet provides traders access to dense, cloud-free satellite data in a time-series for the purpose of identifying crop types early in the season. This allows them to calculate crop acreage across broad regions well ahead of public reports. Traders can then add food crop acreage information into their models to inform yield estimations, price projections, and trading decisions – giving them a competitive edge. 
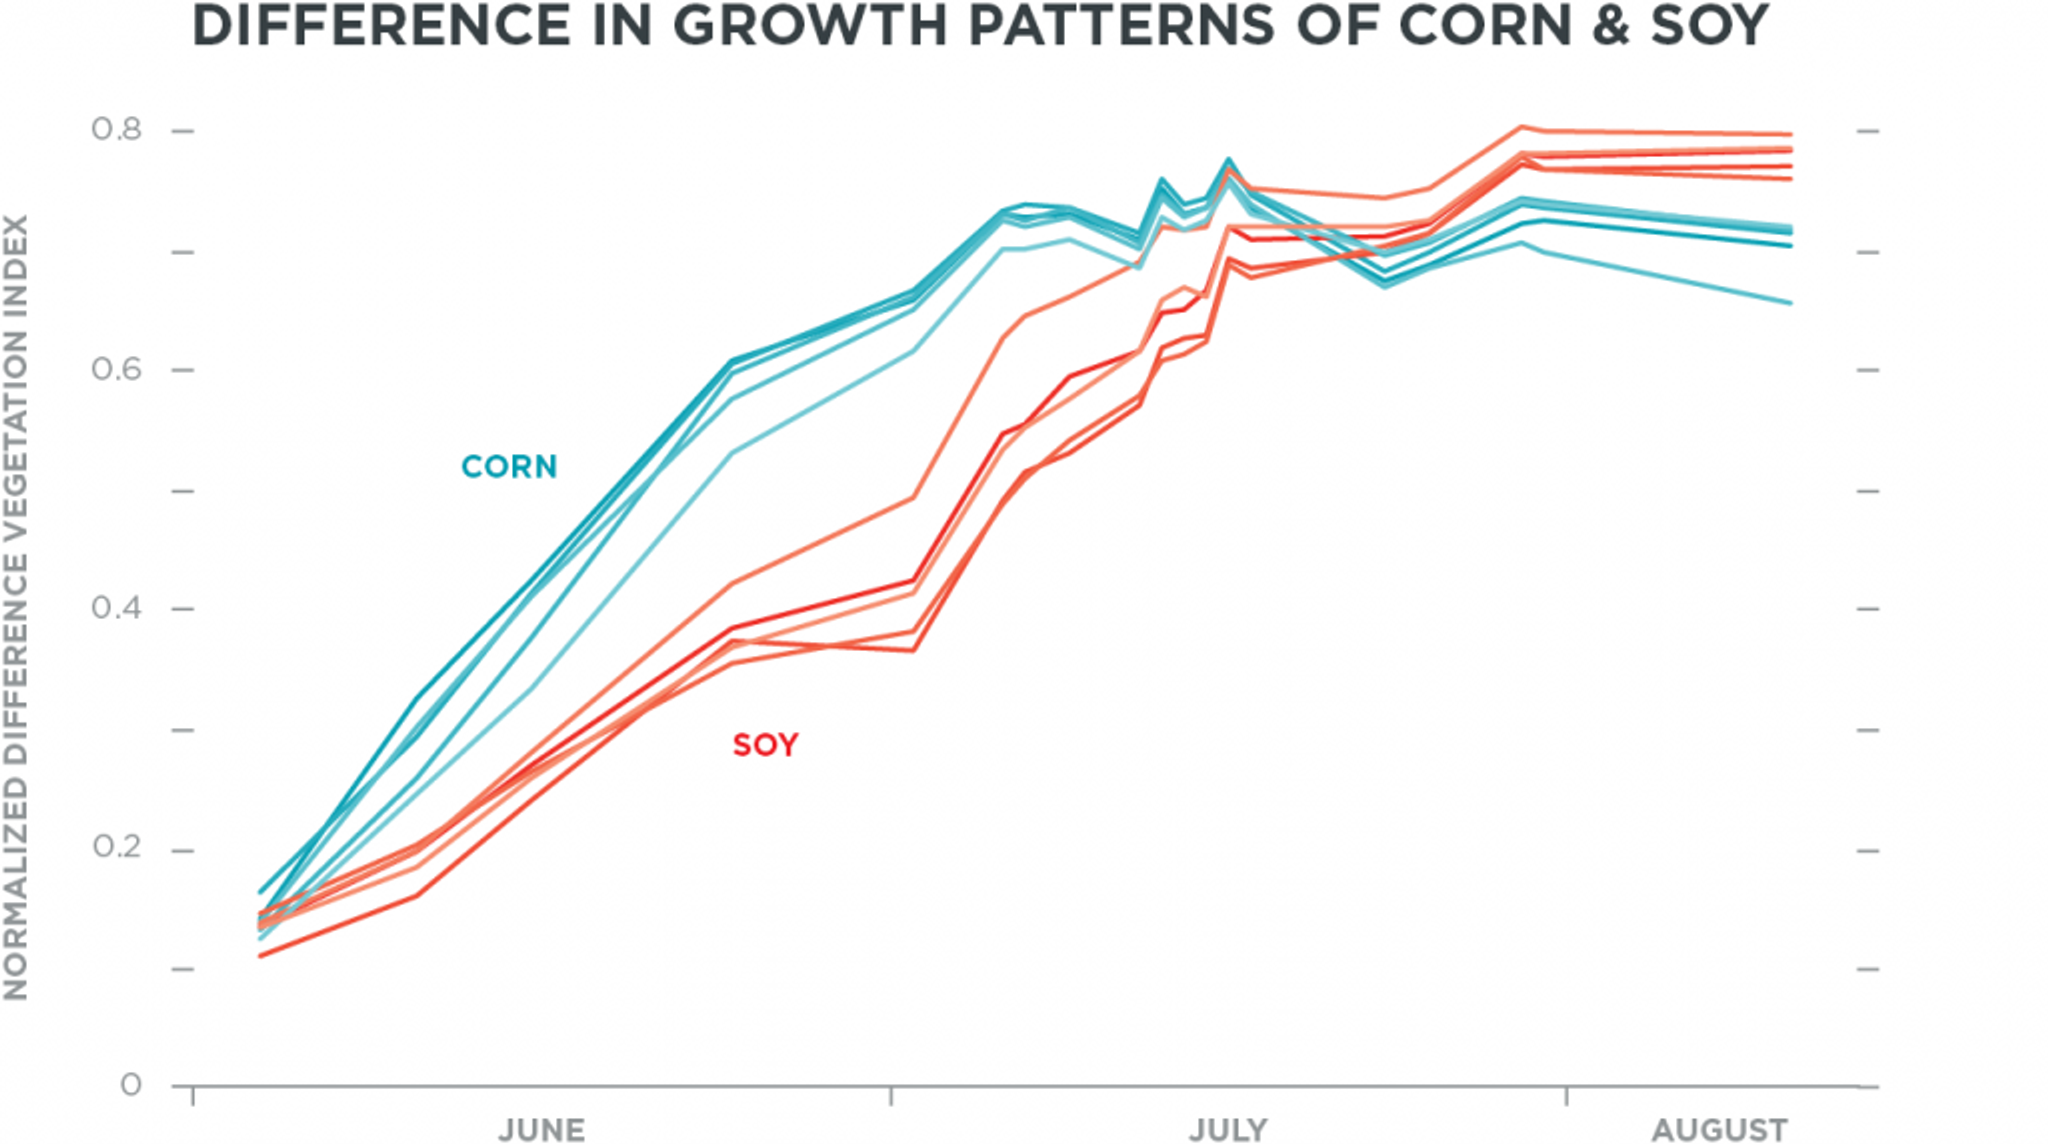
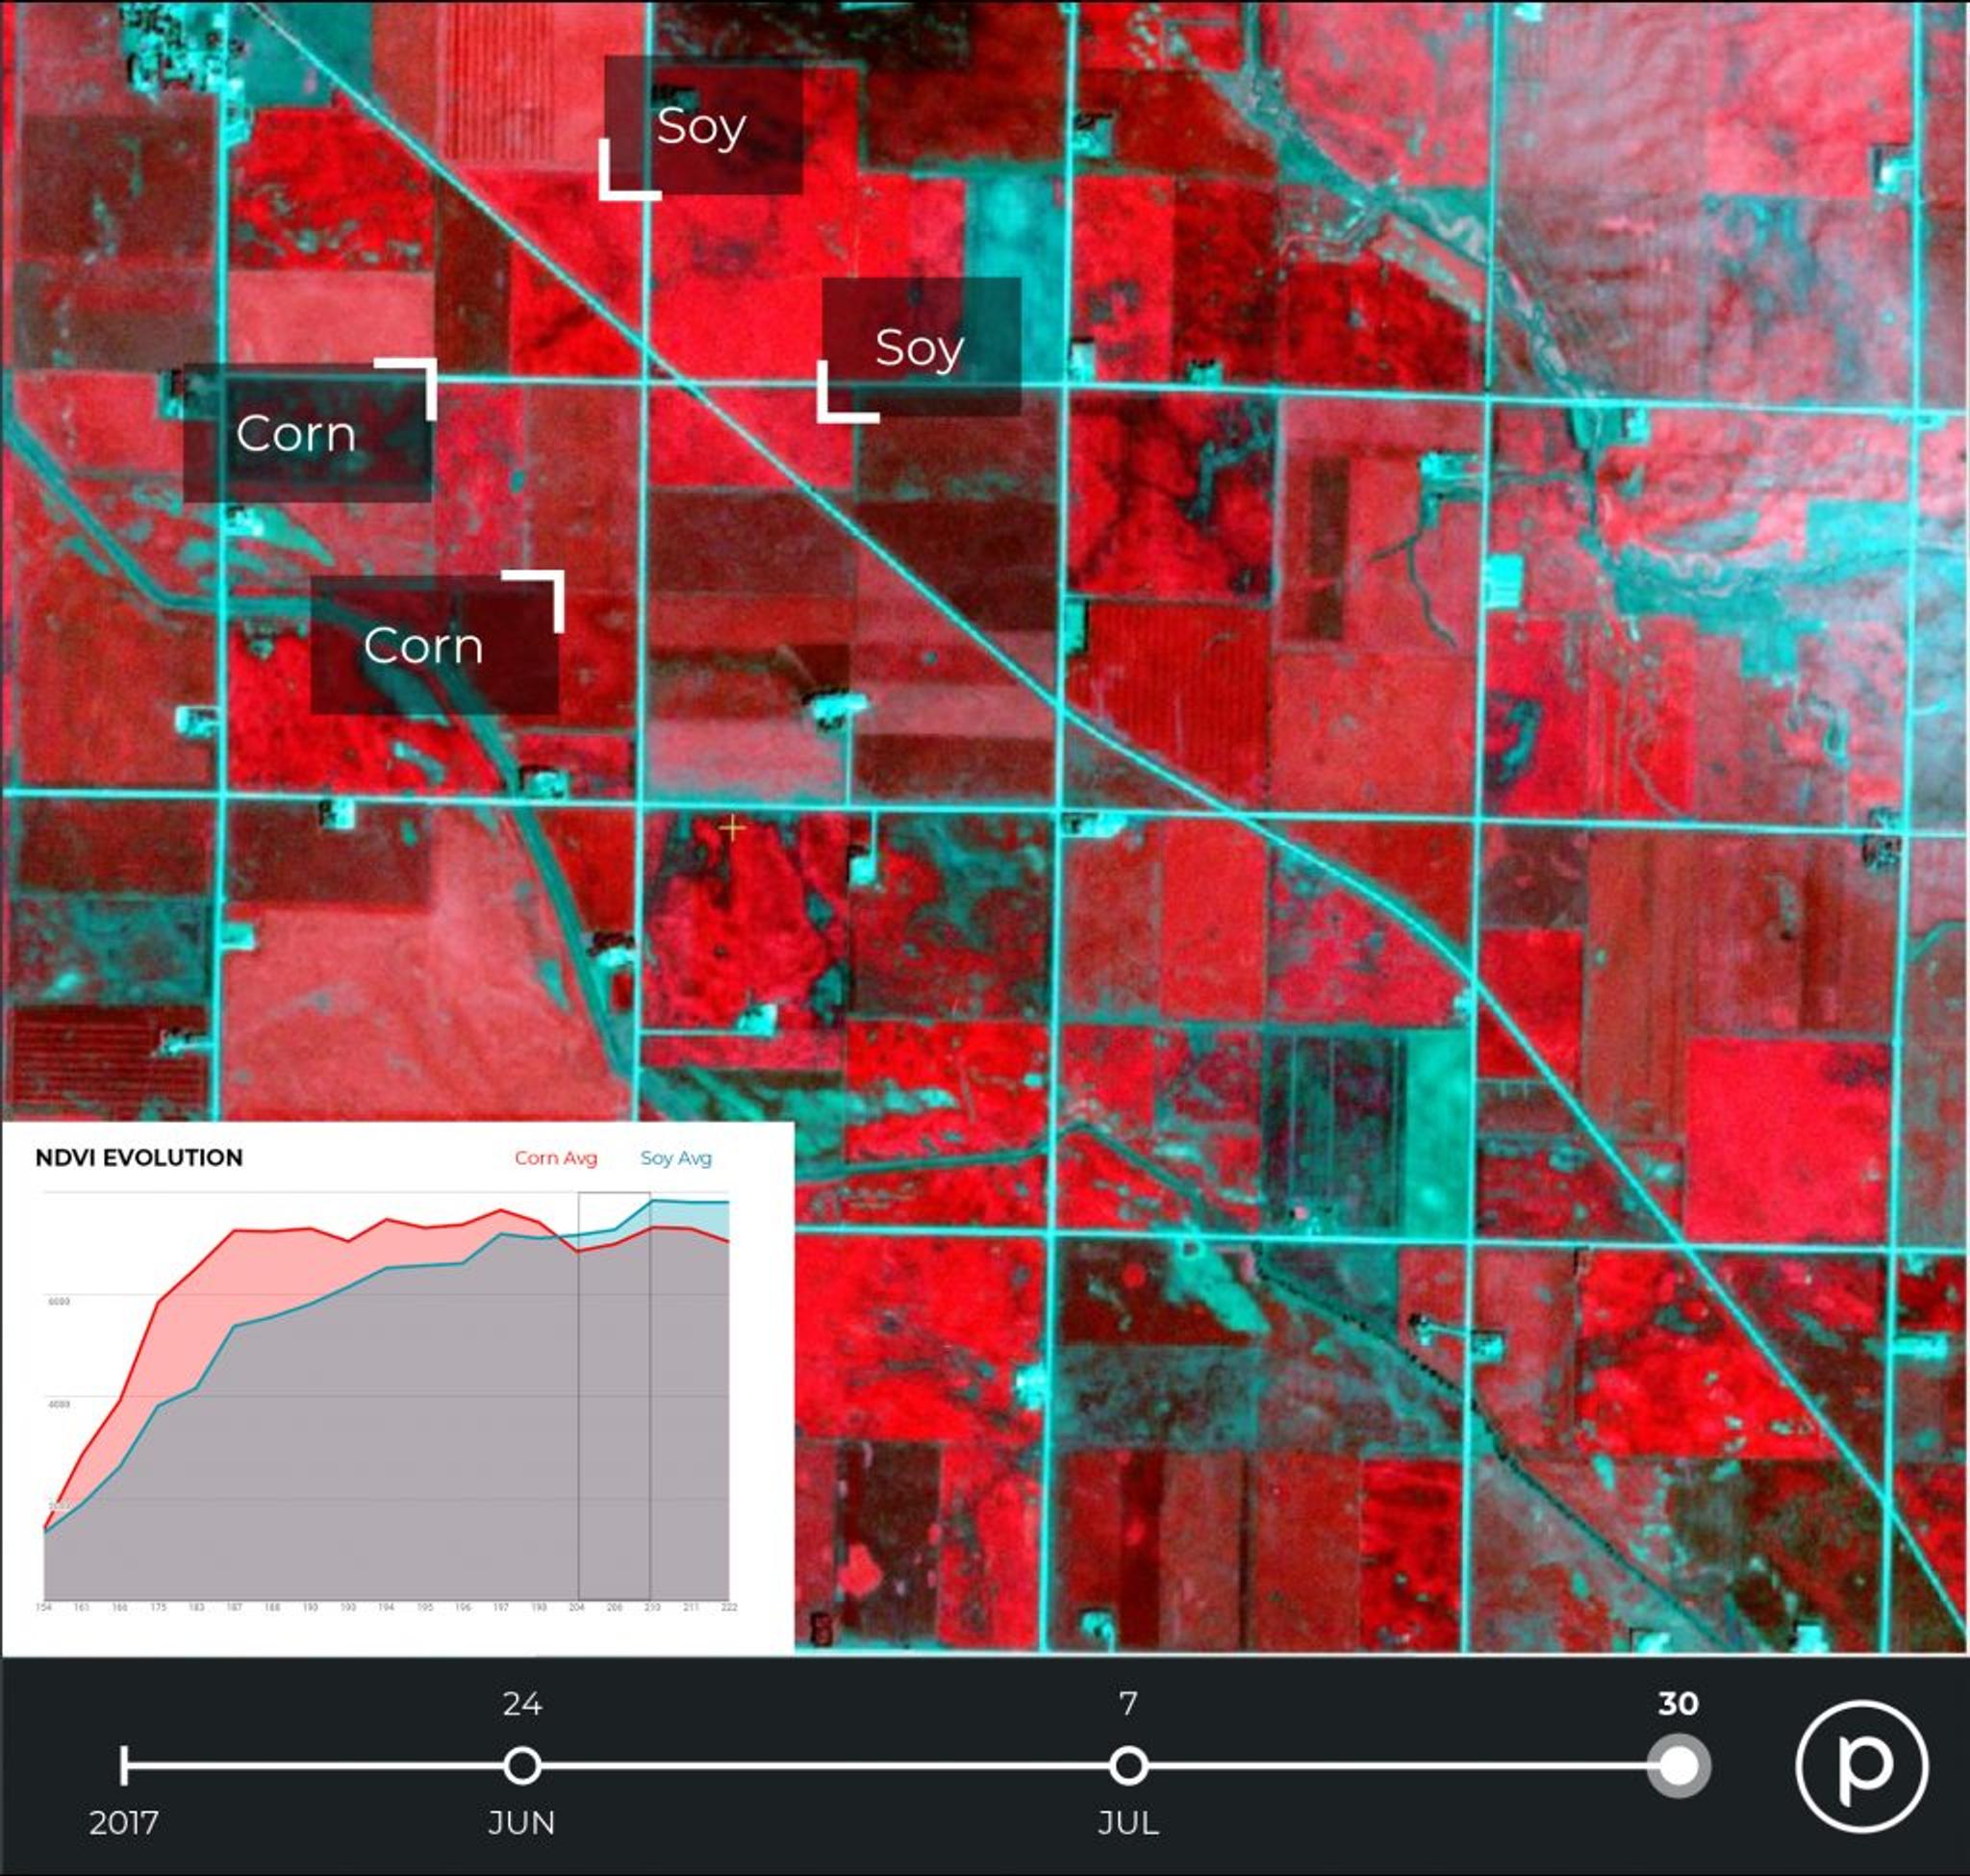
Here’s how it’s done.

Using the visible and near-infrared sensors on its satellites, Planet can derive a time series of spectral vegetation indices such as the Normalized Difference Vegetation Index (NDVI), which measures the amount and health of the crops. NDVI measurements over time also show crop lifecycle events (ie, start of season, peak vegetative phase, start of senescence), which is helpful for distinguishing different crop types.

The graph below compares changes in NDVI of each crop over time in a selection of fields in Rolfe, Iowa, between early June to mid-August 2017.

Differences in greening allow corn and soy fields to be distinguished in PlanetScope imagery using NDVI.

Corn fields green rapidly early in the growing season, and their NDVI falls slightly later in the season as it enters the reproductive growth phase (see red lines). Soy greens slowly relative to corn, but the NDVI continues to slowly rise through mid-August (blue lines).

The different spectral signatures of each crop can also been seen in false color near-infrared composite below: corn fields appear red, indicating a significant amount of biomass, while the soy fields appear blue because they haven’t started to grow and the soil is dominating the reflectance measurement.

With these benchmarks in a sample area, corn and soy fields can be distinguished over the broader region of Rolfe, Iowa.

Over the season, the field’s NDVI values evolve. Corn grows more quickly than soy in the early season and reflects more strongly in the near infrared as a result. By early July, corn fields reach peak NDVI values while soy fields maintain lower values. As the soy crop begins to grow, it gains a reddish tone that still has some blue (the soil) mixed in. This shows that the soil is still contributing significantly to reflectance. In late July, the NDVI of corn fields drops slightly, indicating they have entered the tasseling phase, while the NDVI of soy fields reaches maximum.

Using NDVI at specific dates may not be sufficient for distinguishing the two crop types because they can have similar values. However, corn and soy retain a unique spectral reflectance in the visible and near-infrared bands: at the end of July, corn fields are dark red and soy fields are bright red.

The high cadence of Planet’s imagery allows for multiple captures in the four to six weeks leading up to June 29, when the USDA report is typically published. In contrast, less frequent imagery, with the high chance of being obscured by clouds, can impact the quality of the data and analysis.

With more high quality images over the early growing season, Planet’s crop identification gets more accurate, thus enhancing crop acreage predictions by mid-June. The area of these distinct crops can be calculated to provide acreage information (shown below). In this particular example, we estimated 21,000 hectares of soy and 28,000 hectares of corn over the given area in Rolfe, Iowa on June 18, 2017.

A land cover classification map produced on June 18, 2018. Corn is represented in yellow, soy is represented in brown, water is represented in blue, and infrastructure is represented in red.  

This advance crop acreage information can be fed into traders’ models to inform yield estimations, price projections, and trading decisions. Armed with frequent, high-resolution data on what’s happening in specific fields and across multiple sites, both traders and farmers can make more informed decisions about yields, and best of all, ahead of when competitors get access to the information.

Interested in learning how Planet can help monitor and measure crop acreage for your area of interest? Get a demo by contacting our ag team.