
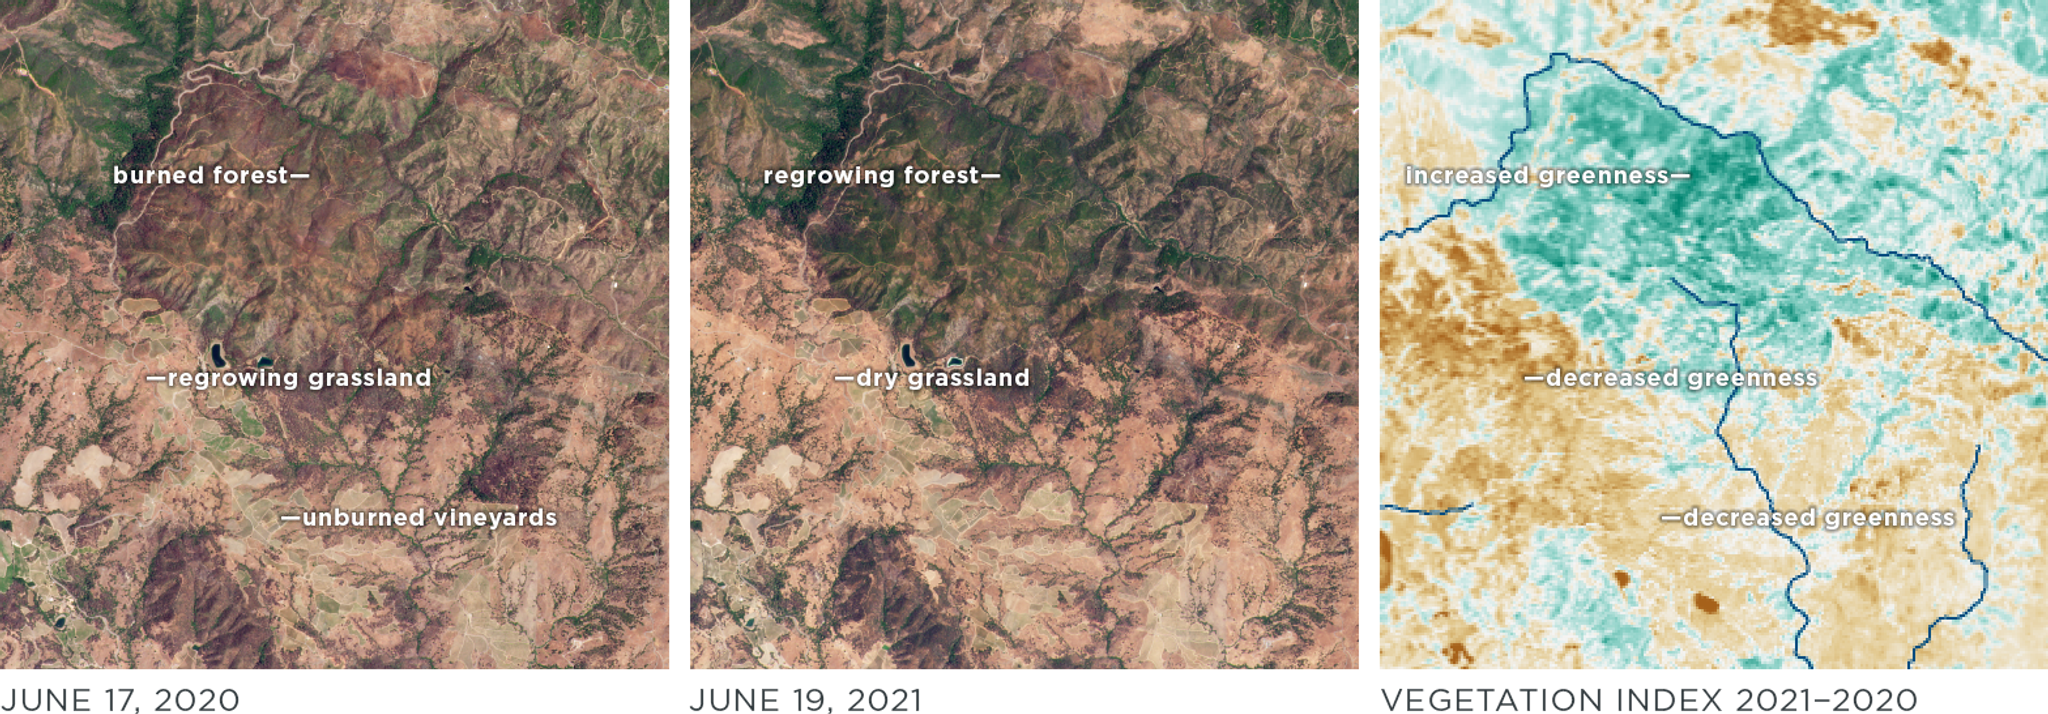
Using NDVI Differences to Measure Drought in the Russian River Watershed
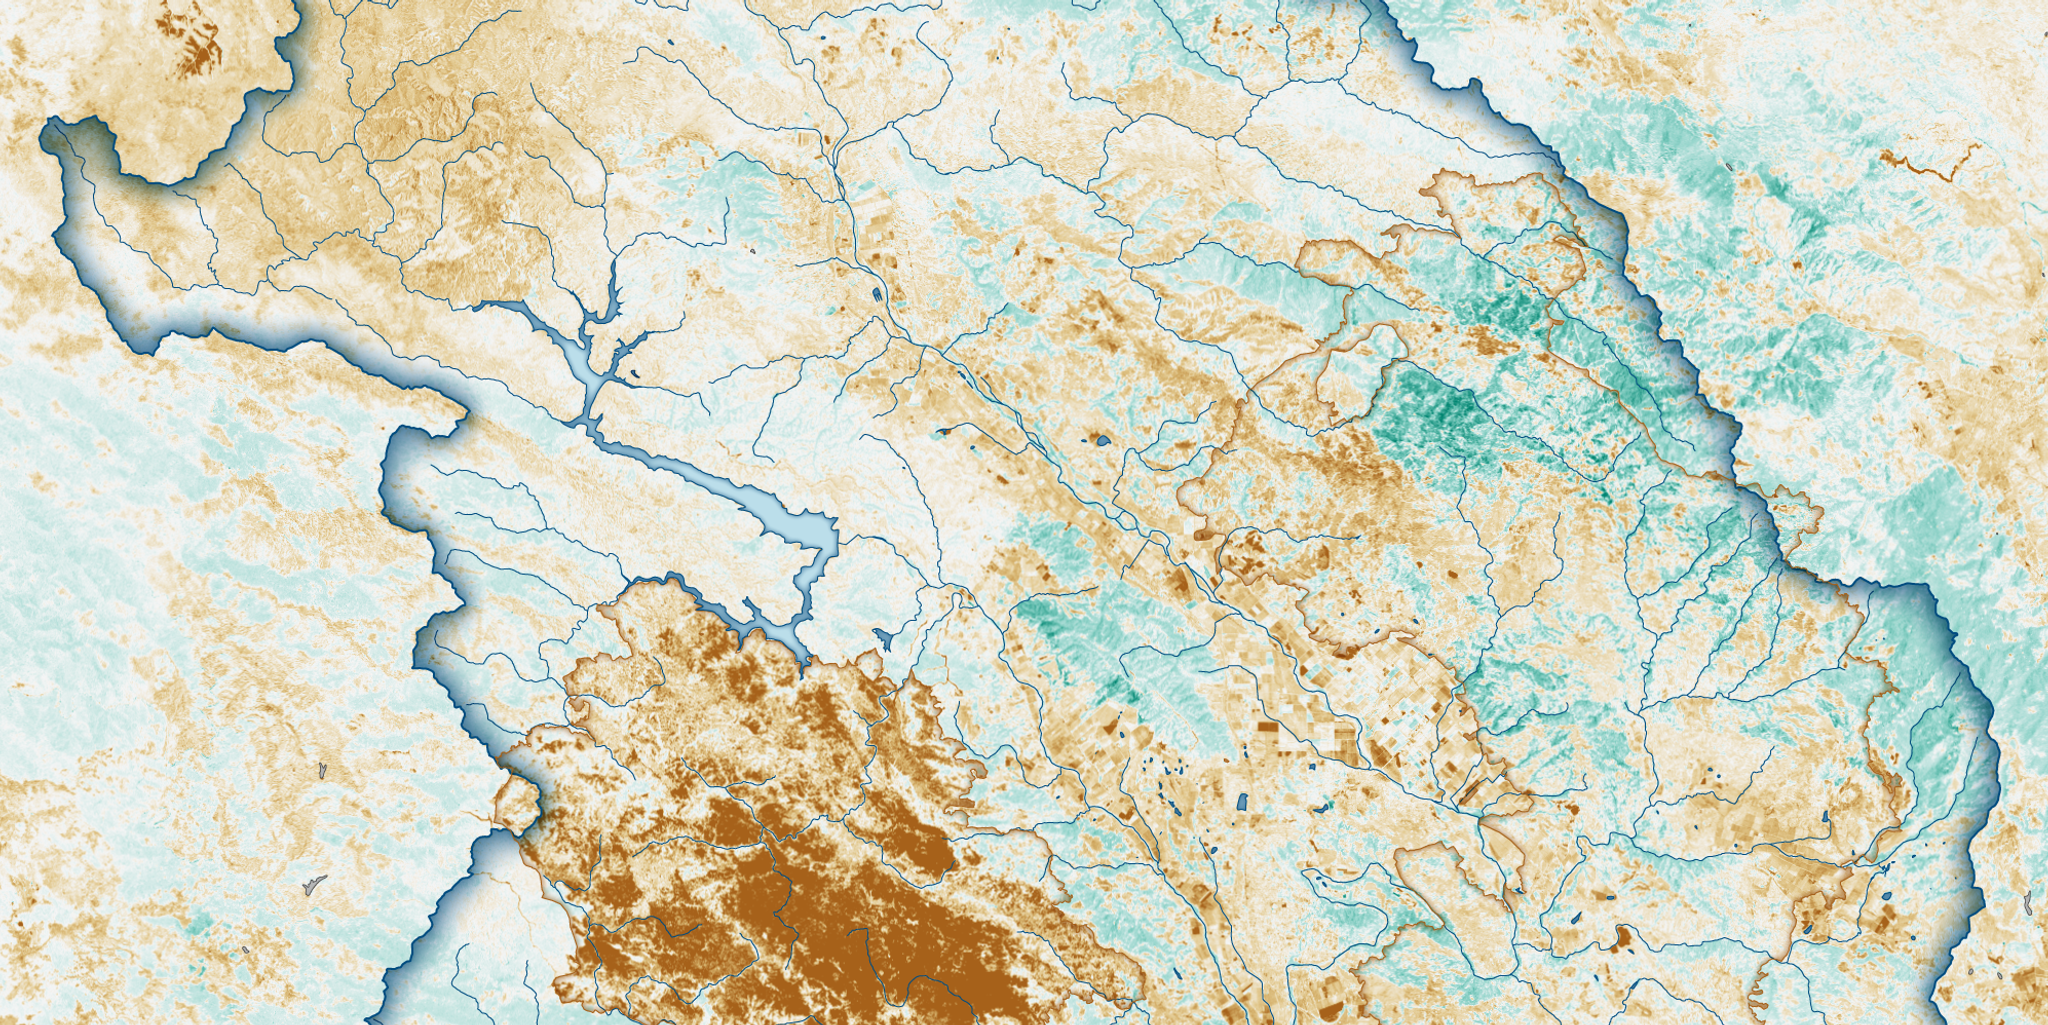
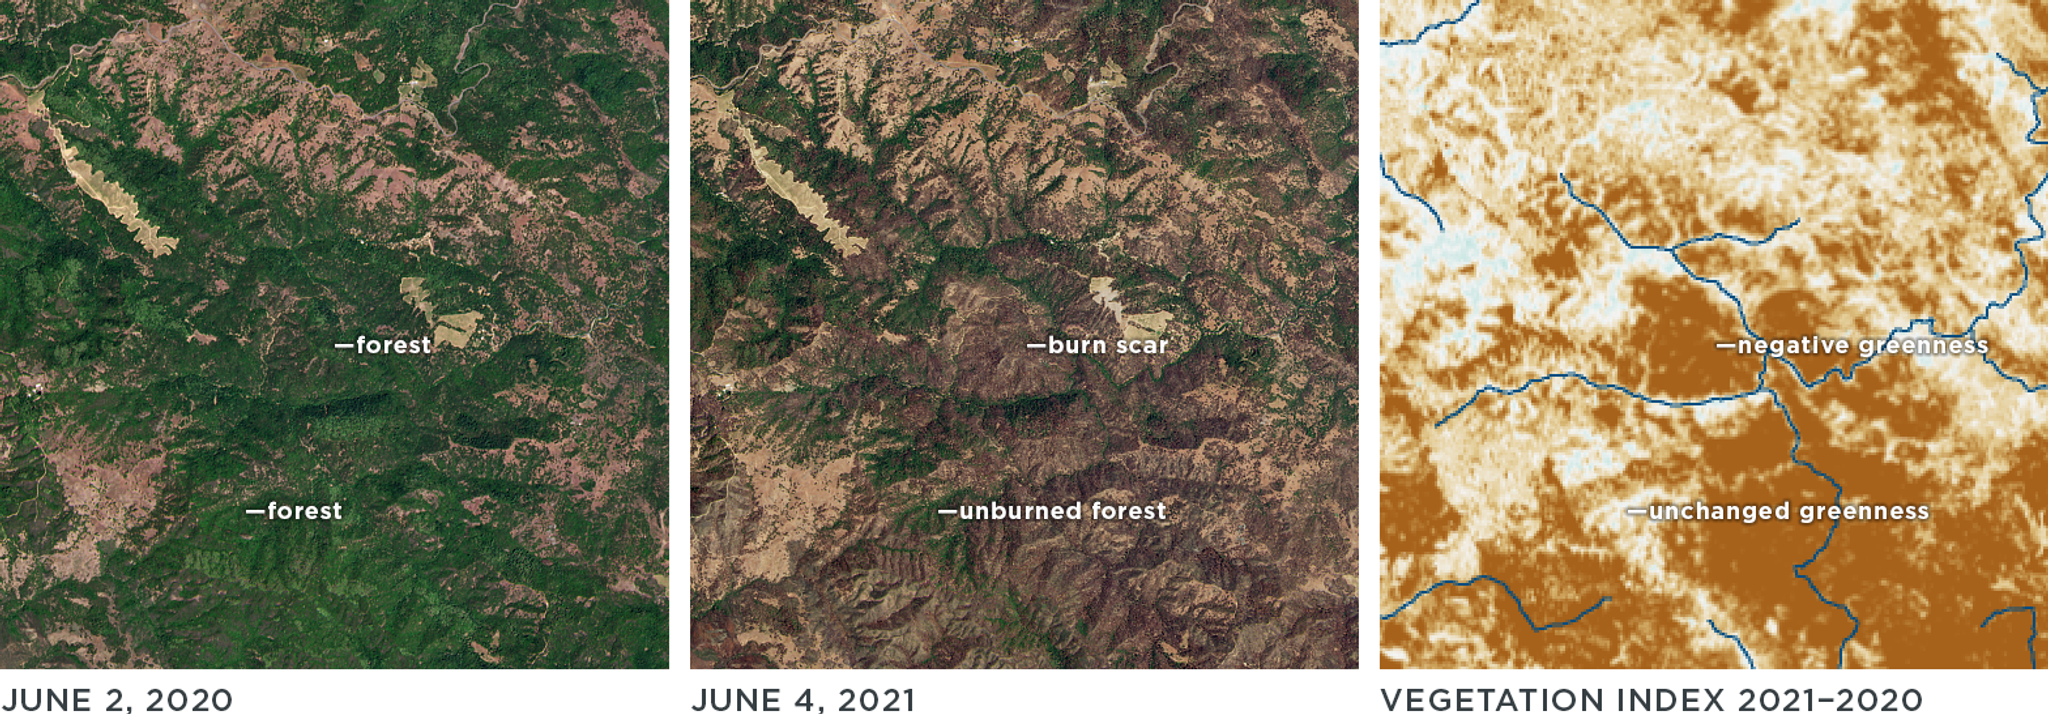
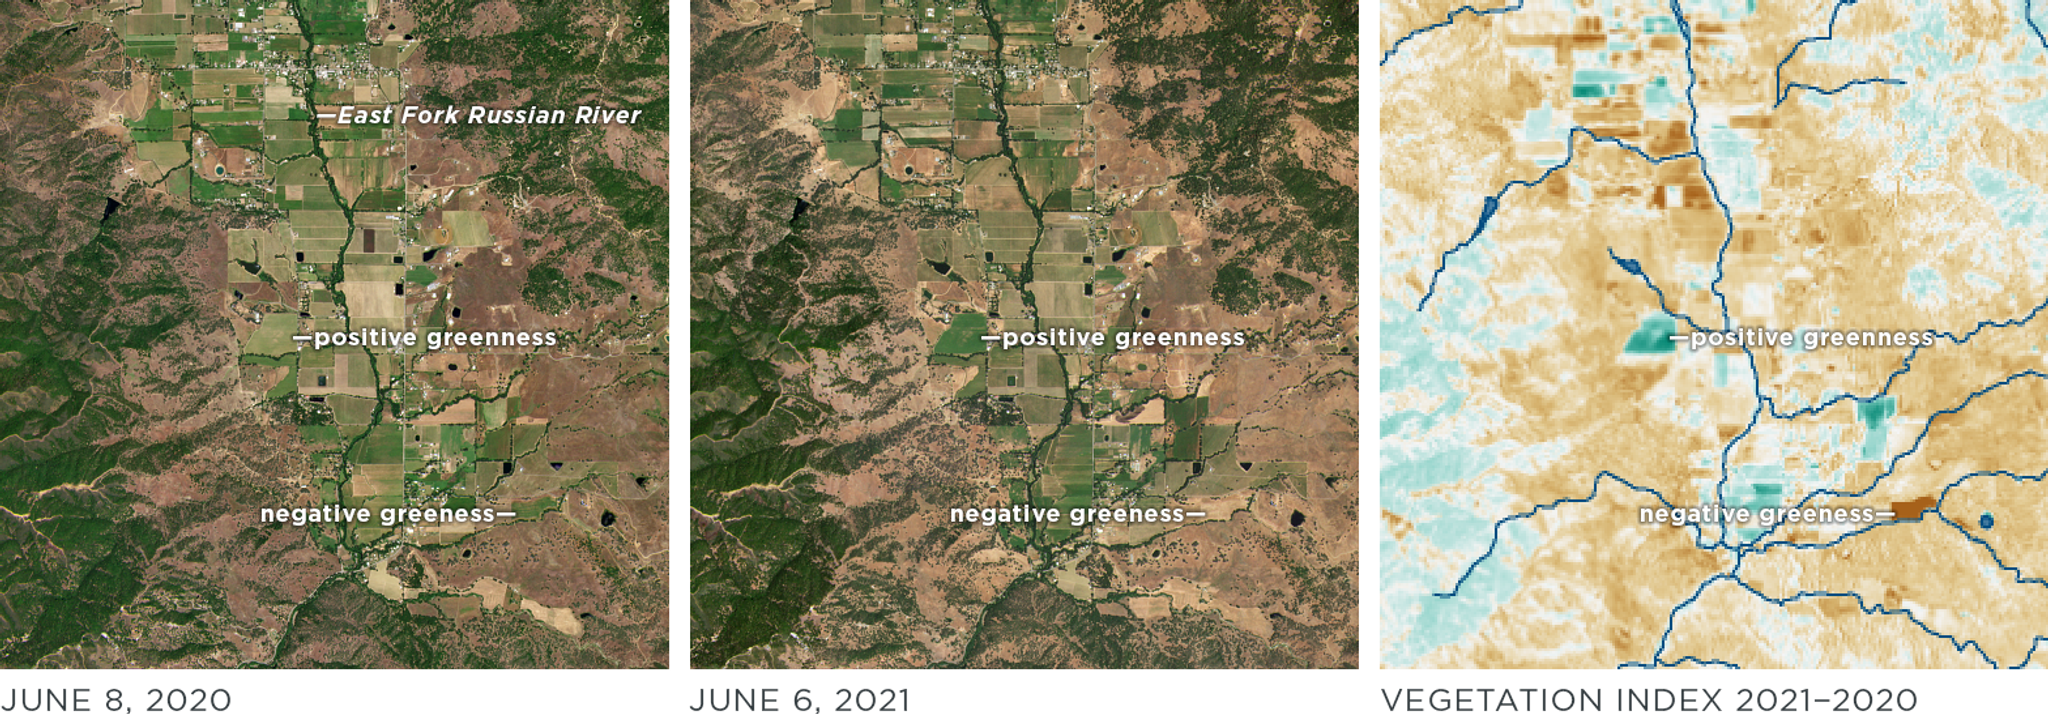
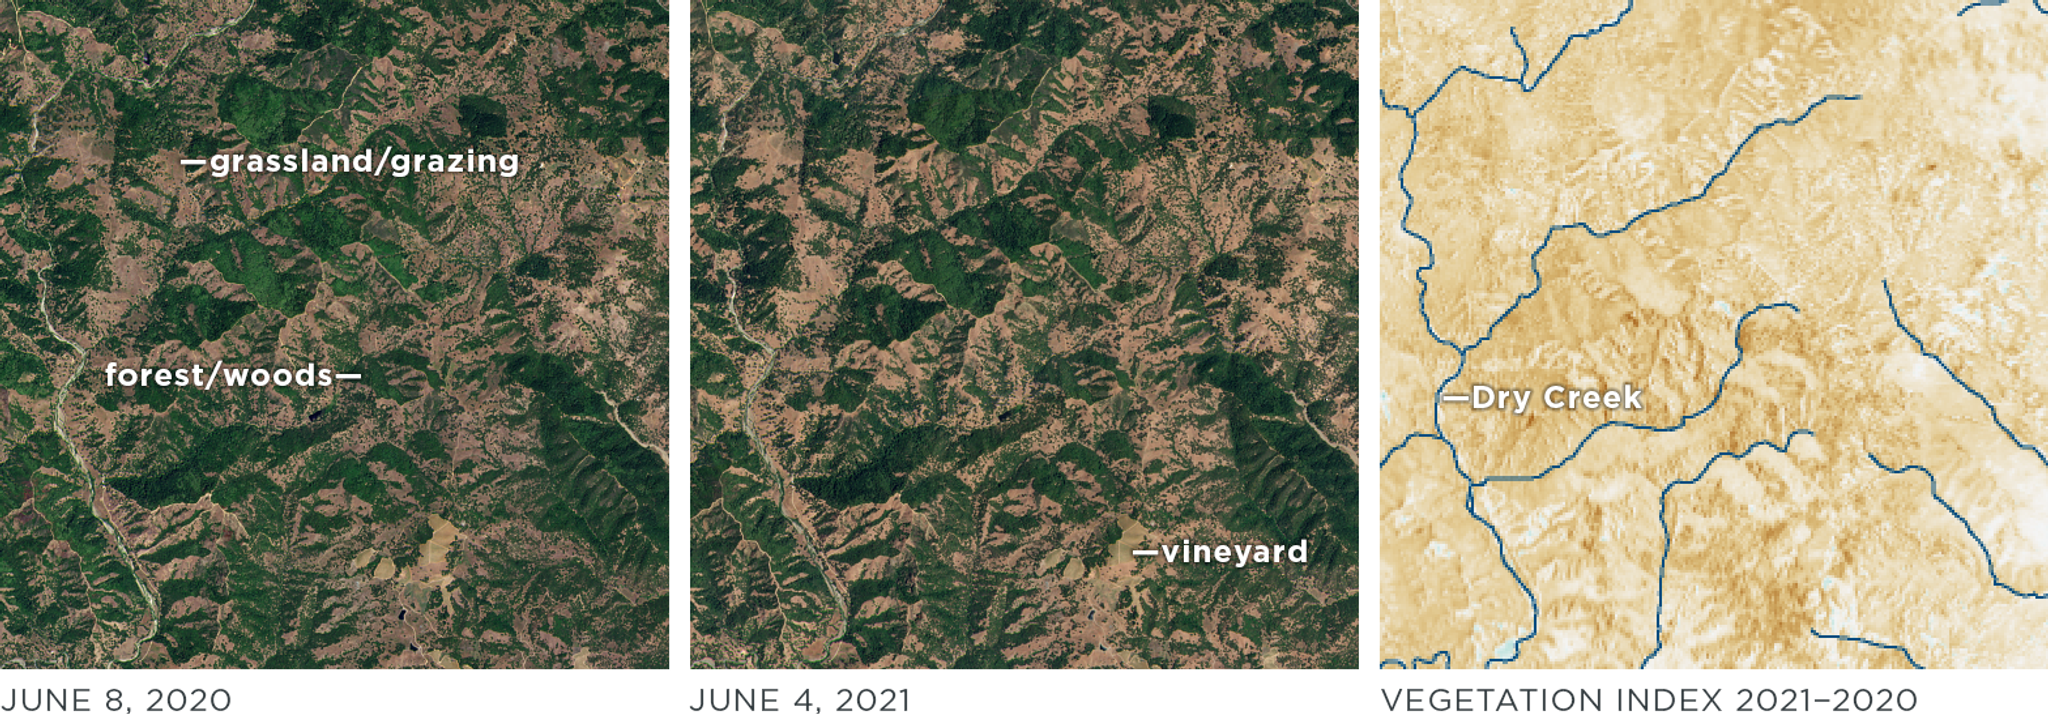
This map compares normalized difference vegetation index (NDVI) — a measure of plant health — in California’s Russian River Watershed from the first two weeks in June 2021 and 2020. © 2021, Planet Labs Inc. All Rights Reserved.
Stories
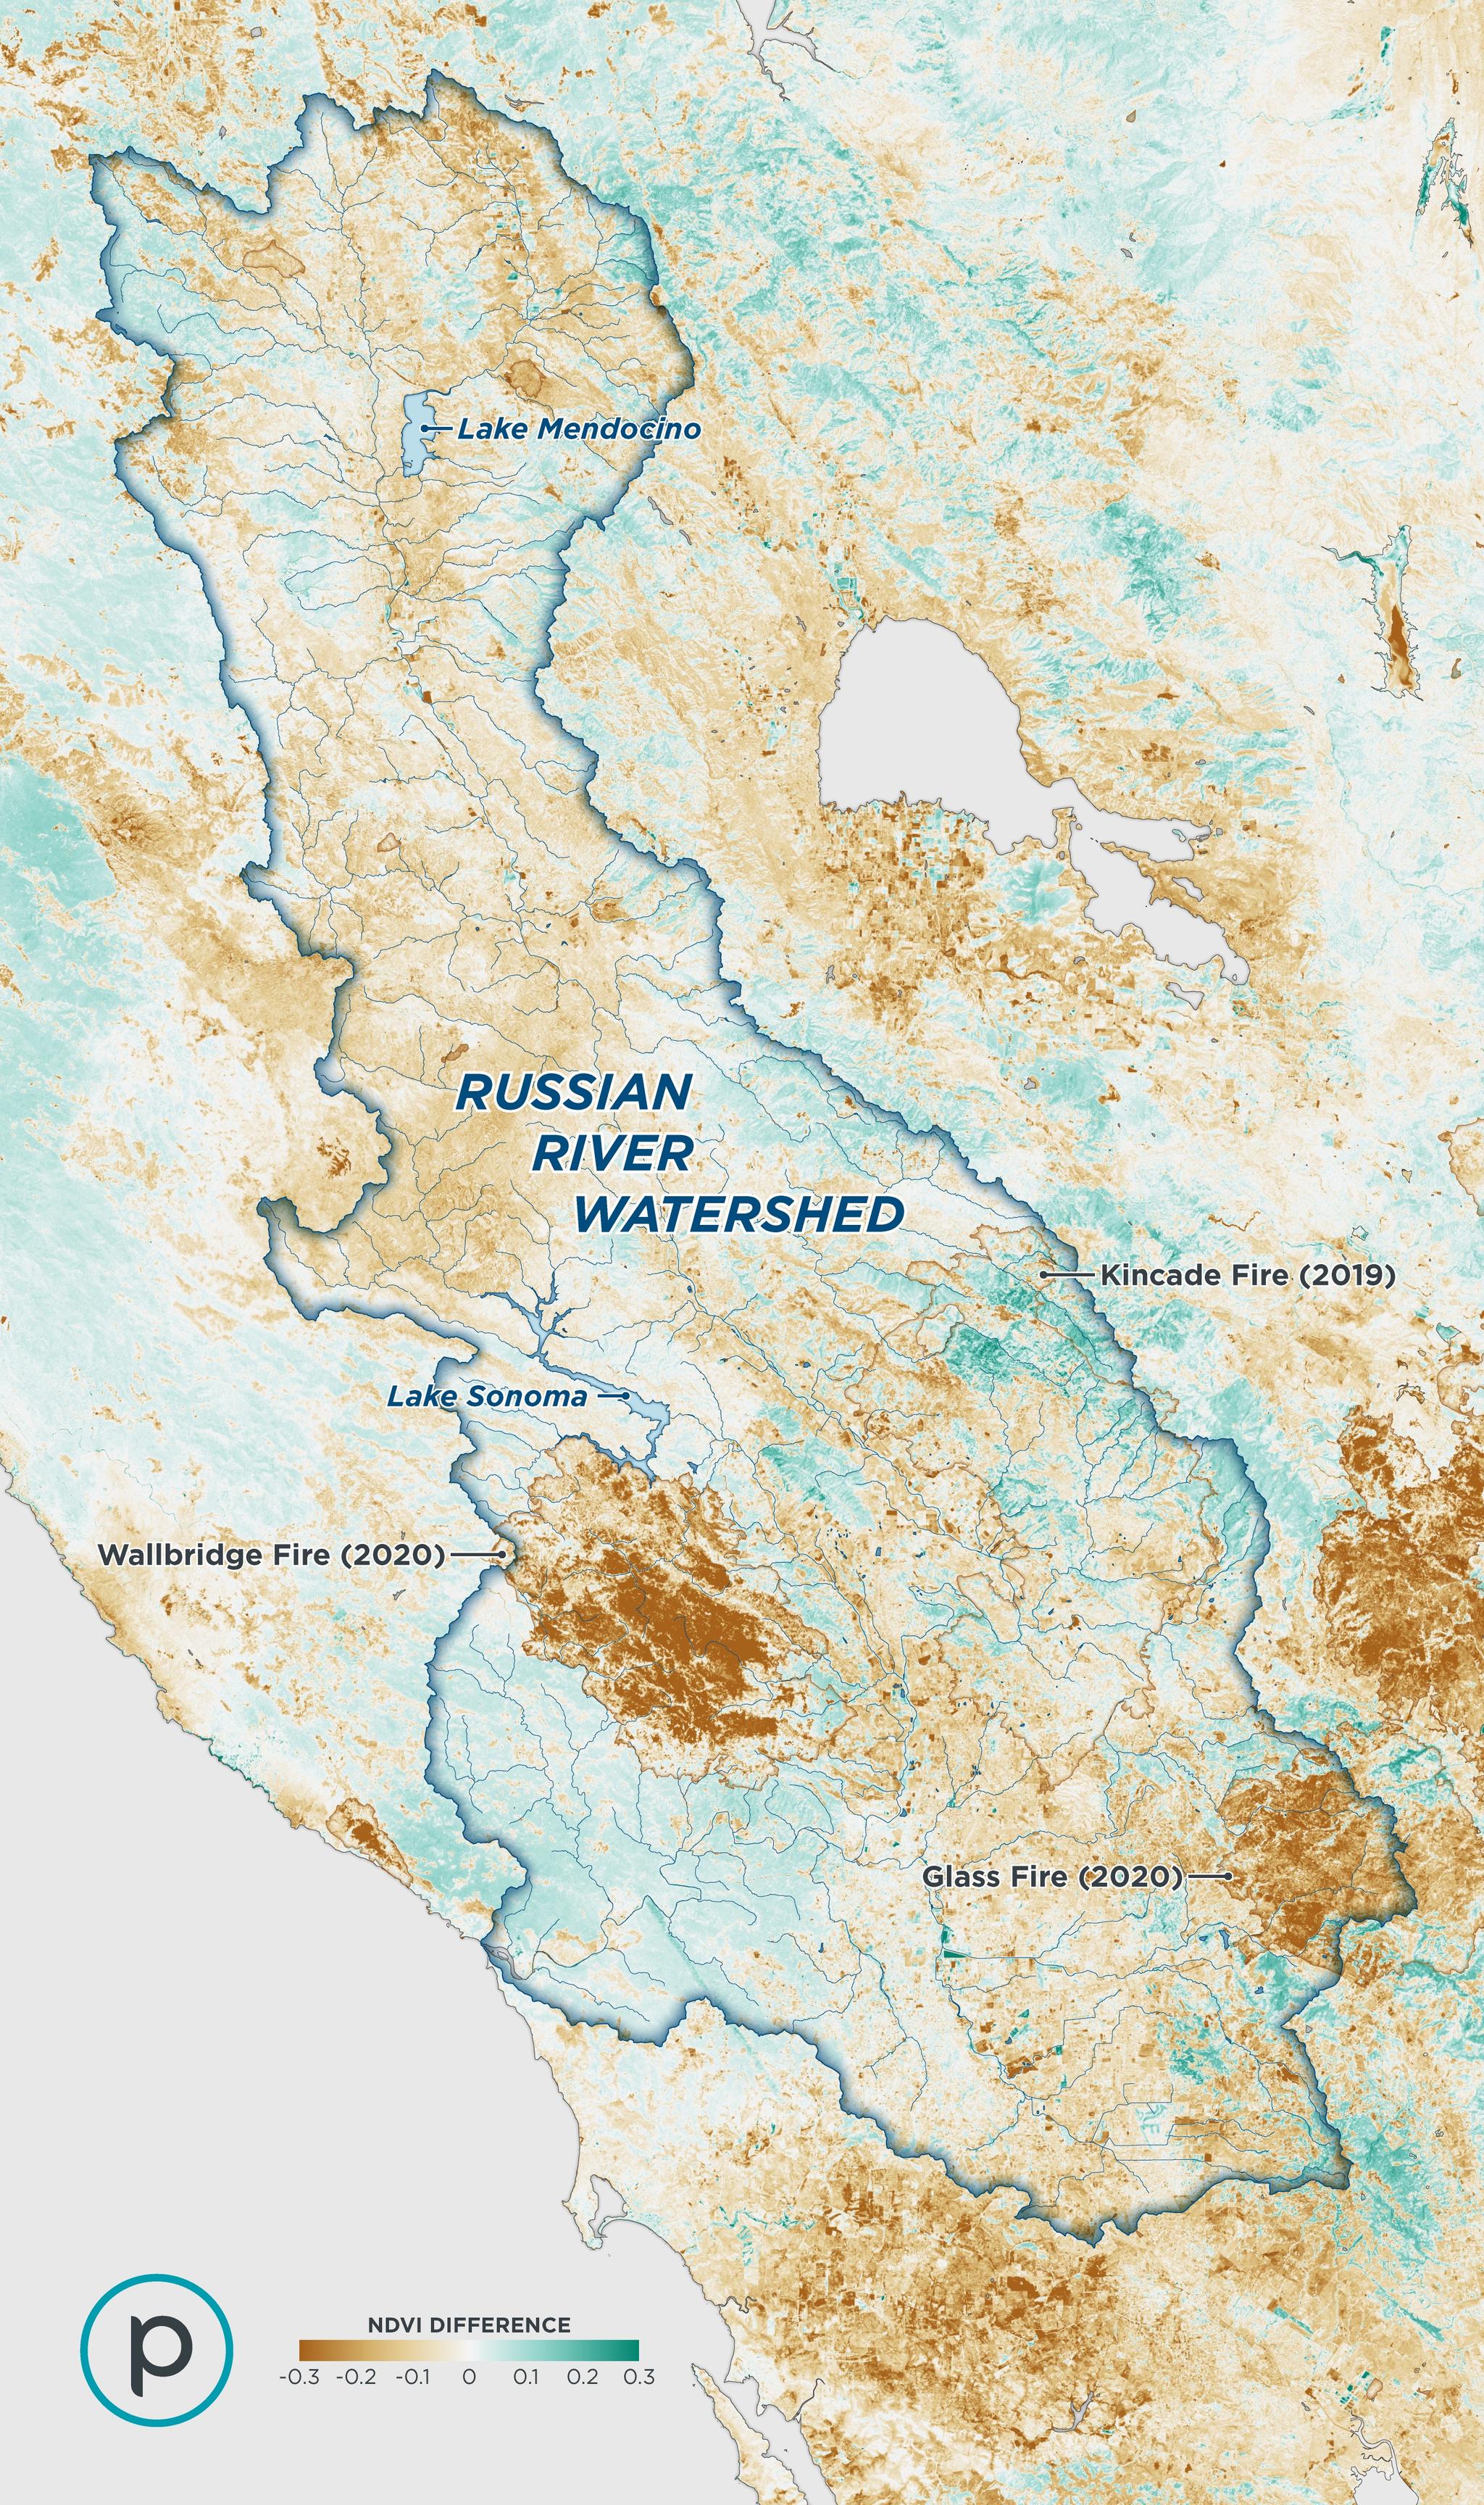
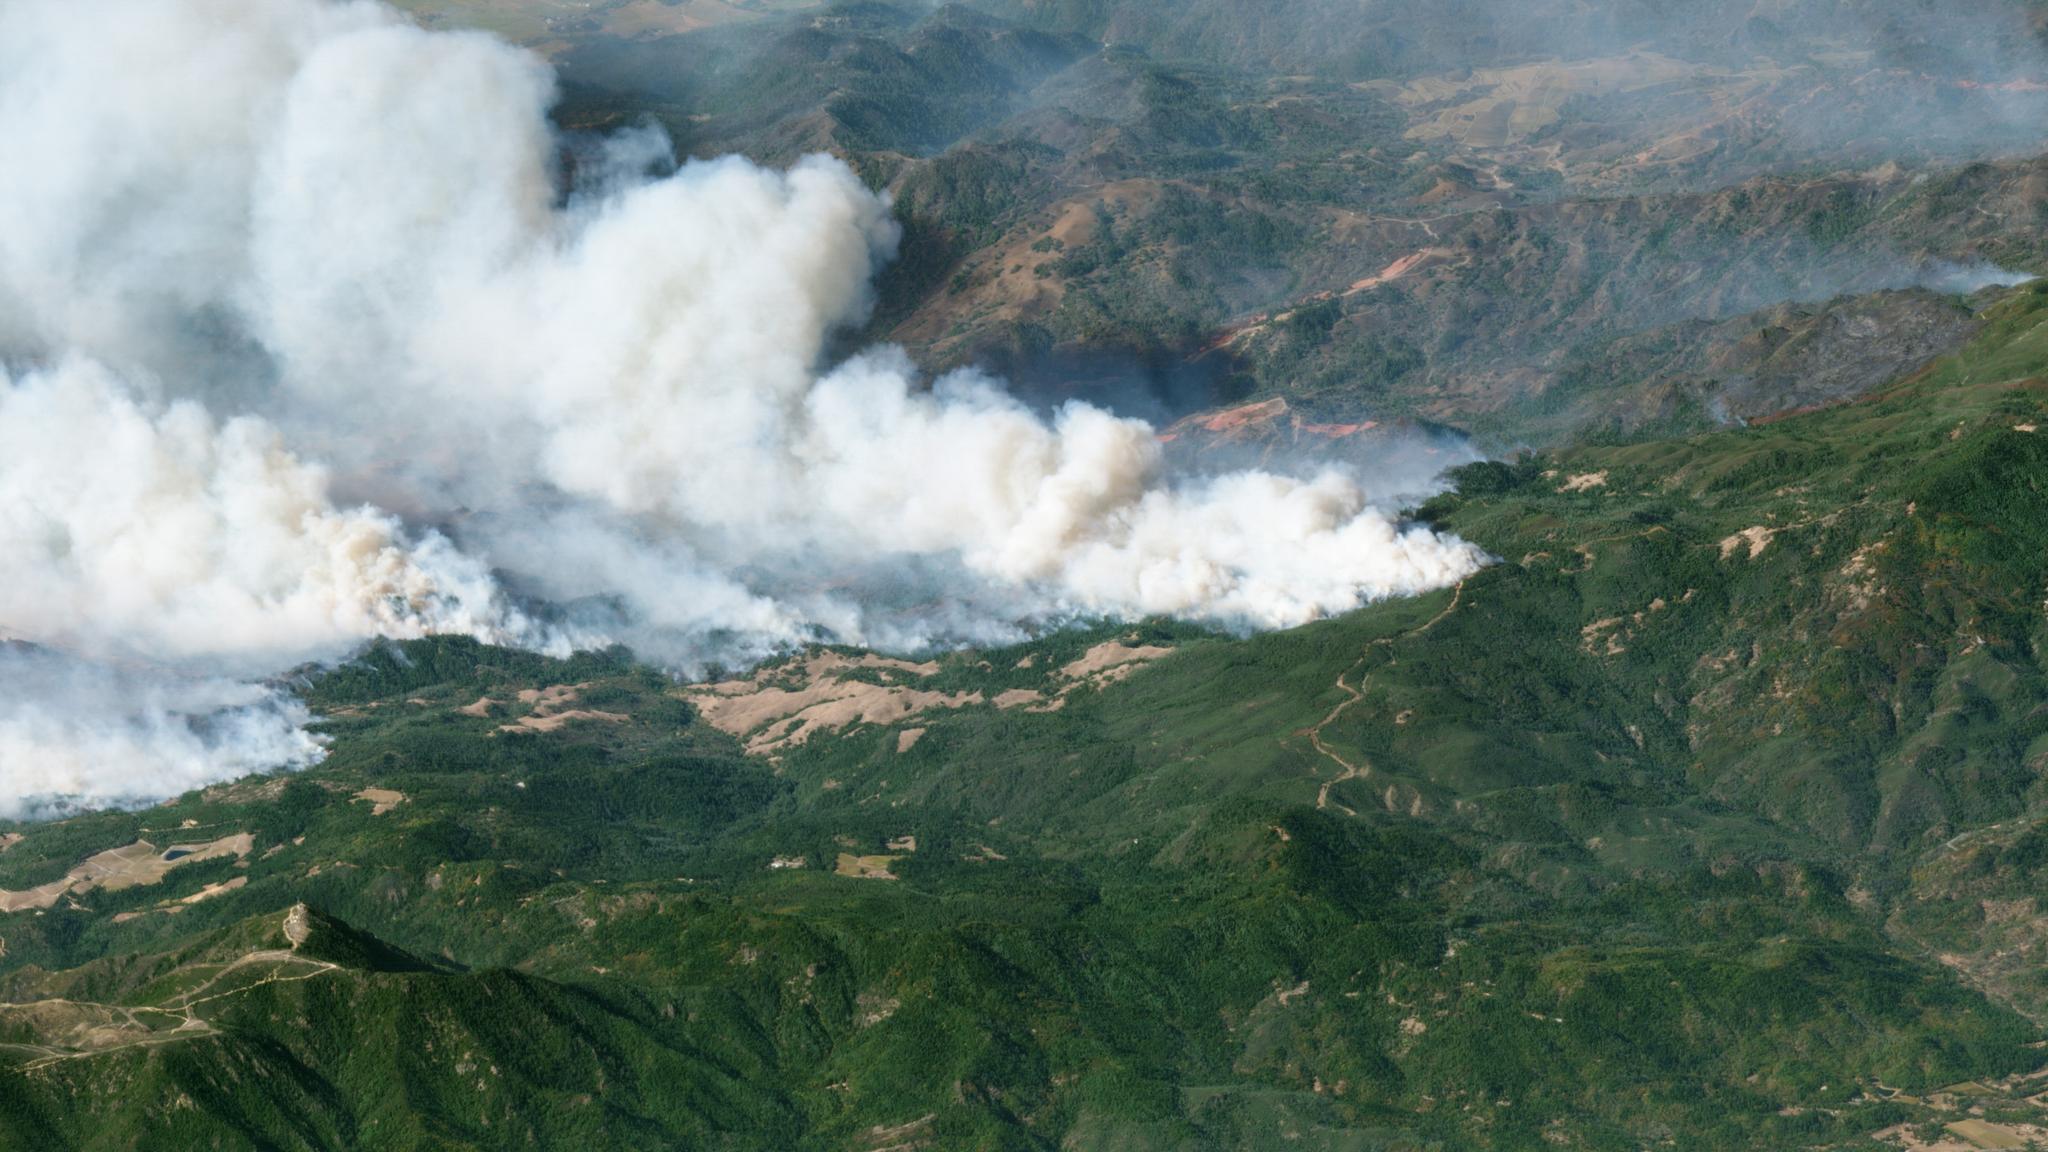
Wallbridge Fire
[caption id="attachment_146976" align="aligncenter" width="1568"]
Agriculture
[caption id="attachment_146931" align="aligncenter" width="1568"]
Undeveloped Land
[caption id="attachment_146930" align="aligncenter" width="1568"]
Kincade Fire
[caption id="attachment_146928" align="aligncenter" width="5305"]
Ready to Get Started
Connect with a member of our Sales team. We'll help you find the right products and pricing for your needs.