
CornCaster: How Planet’s Yield Forecasting Solution is Helping Agriculturists and Economists Get Ahead of This Year’s Harvest
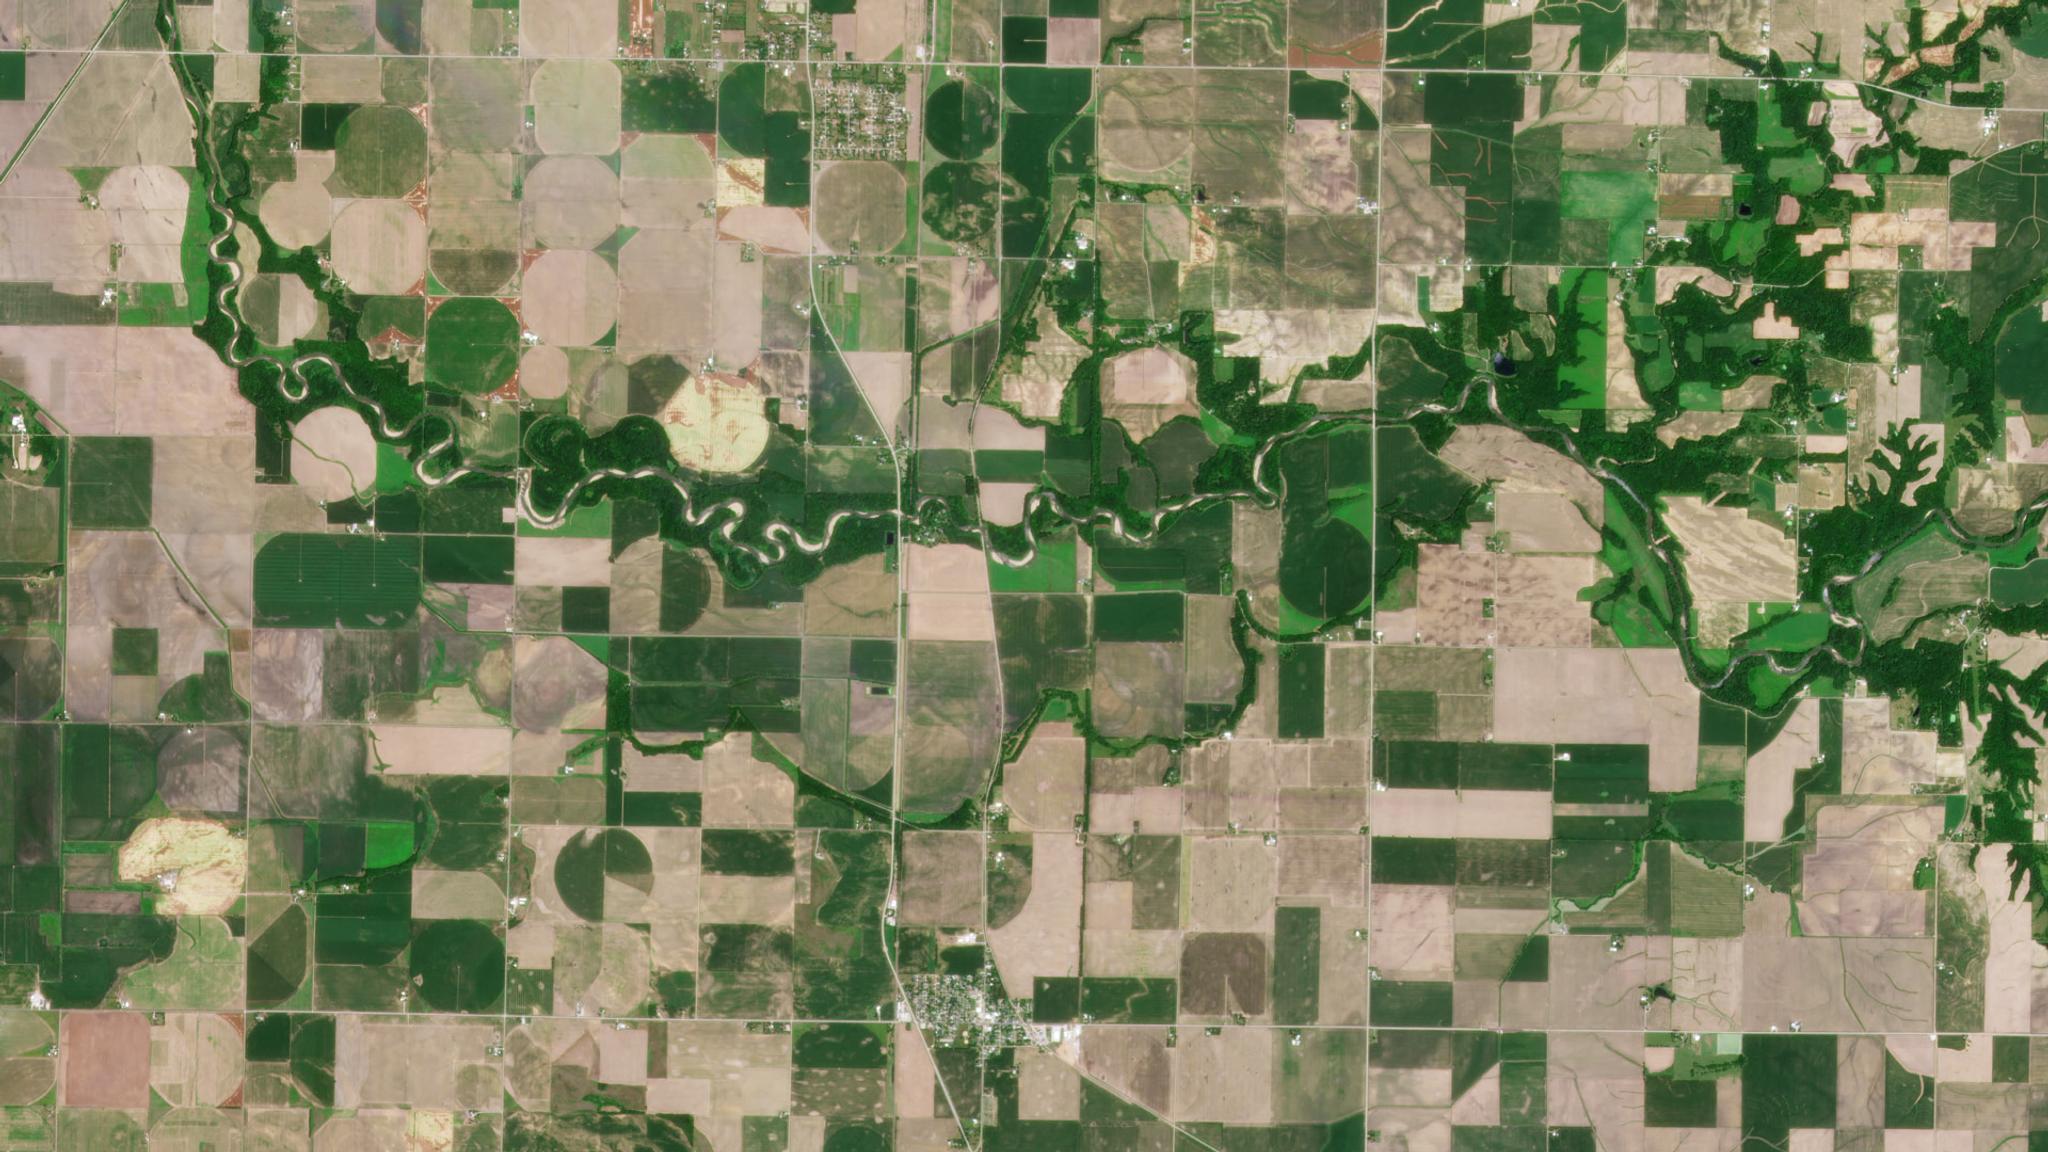
Agricultural fields in Tazewell County, Illinois taken June 22, 2021 © 2021, Planet Labs PBC. All Rights Reserved.
StoriesData analysis and visualizations contributed by: Guyon Duifhuizen, Max Borrmann, and Rob Simmon
This harvest season, global eyes are watching the United States’ agricultural yield reports with anticipation after fields around the world have been challenged by extreme weather, drought, heat waves, and political turmoil. The United States is the world’s largest corn producer and second largest soybean grower, and news about production yields can impact global prices for the entire season. Some recent reports have suggested that corn yields in the United States could be the lowest since drought-plagued 2012, and that corn quality could suffer as a result of hot and dry conditions. However, erratic weather patterns can make it difficult to make predictions, and reports can vary dramatically. Given these challenges, Planet’s Yield Forecasting solution offers a technically advanced method to help agriculturalists and economists be best prepared for the future.
What we see ahead for 2022 harvest
With its variety of unusual weather events, 2022 has already proven to be a challenging year for crop growth in the US Midwest. However, contrary to some national reports for agricultural yield, Planet’s Yield Forecasting solution sees some late-season improvements for corn and soybeans. With predicted yields of 177.6 bu/acre for corn (Fig. 1a) and 51.1 bu/acre for soybeans (Fig. 1b), close to the final yields of 2021, these crops could provide some much needed relief for an already tense global market.
Comparing forecasts
The United States Department of Agriculture (USDA) released their latest September expectations for this season: 172.5 bushels per acre (bu/acre) for corn and 50.5 bu/acre for soybeans, significant drops compared to their August predictions.
However, as we already see with the Planet prediction, the market perception can vary from the reports.
In early August, the situation was quite different. The prediction for corn matched very well between the USDA (175.4 bu/acre), market perception (175.9 bu/acre) and Planet (176.0 bu/acre). For soybeans, the USDA still expected close-to-record yields (51.9 bu/acre), while the market perception (51.1 bu/acre) and Planet (50.4 bu/acre) predictions were more tempered.
Figure 1c and 1d visualize how the USDA and Planet predictions historically compare to the actual final yields. The variability in these numbers are an example of the associated uncertainty that lies underneath these predictions. This uncertainty can translate back into market volatility and overreactions on short term weather events. Therefore, to put these Planet predictions in the right perspective, it is important to understand its fundamentals.
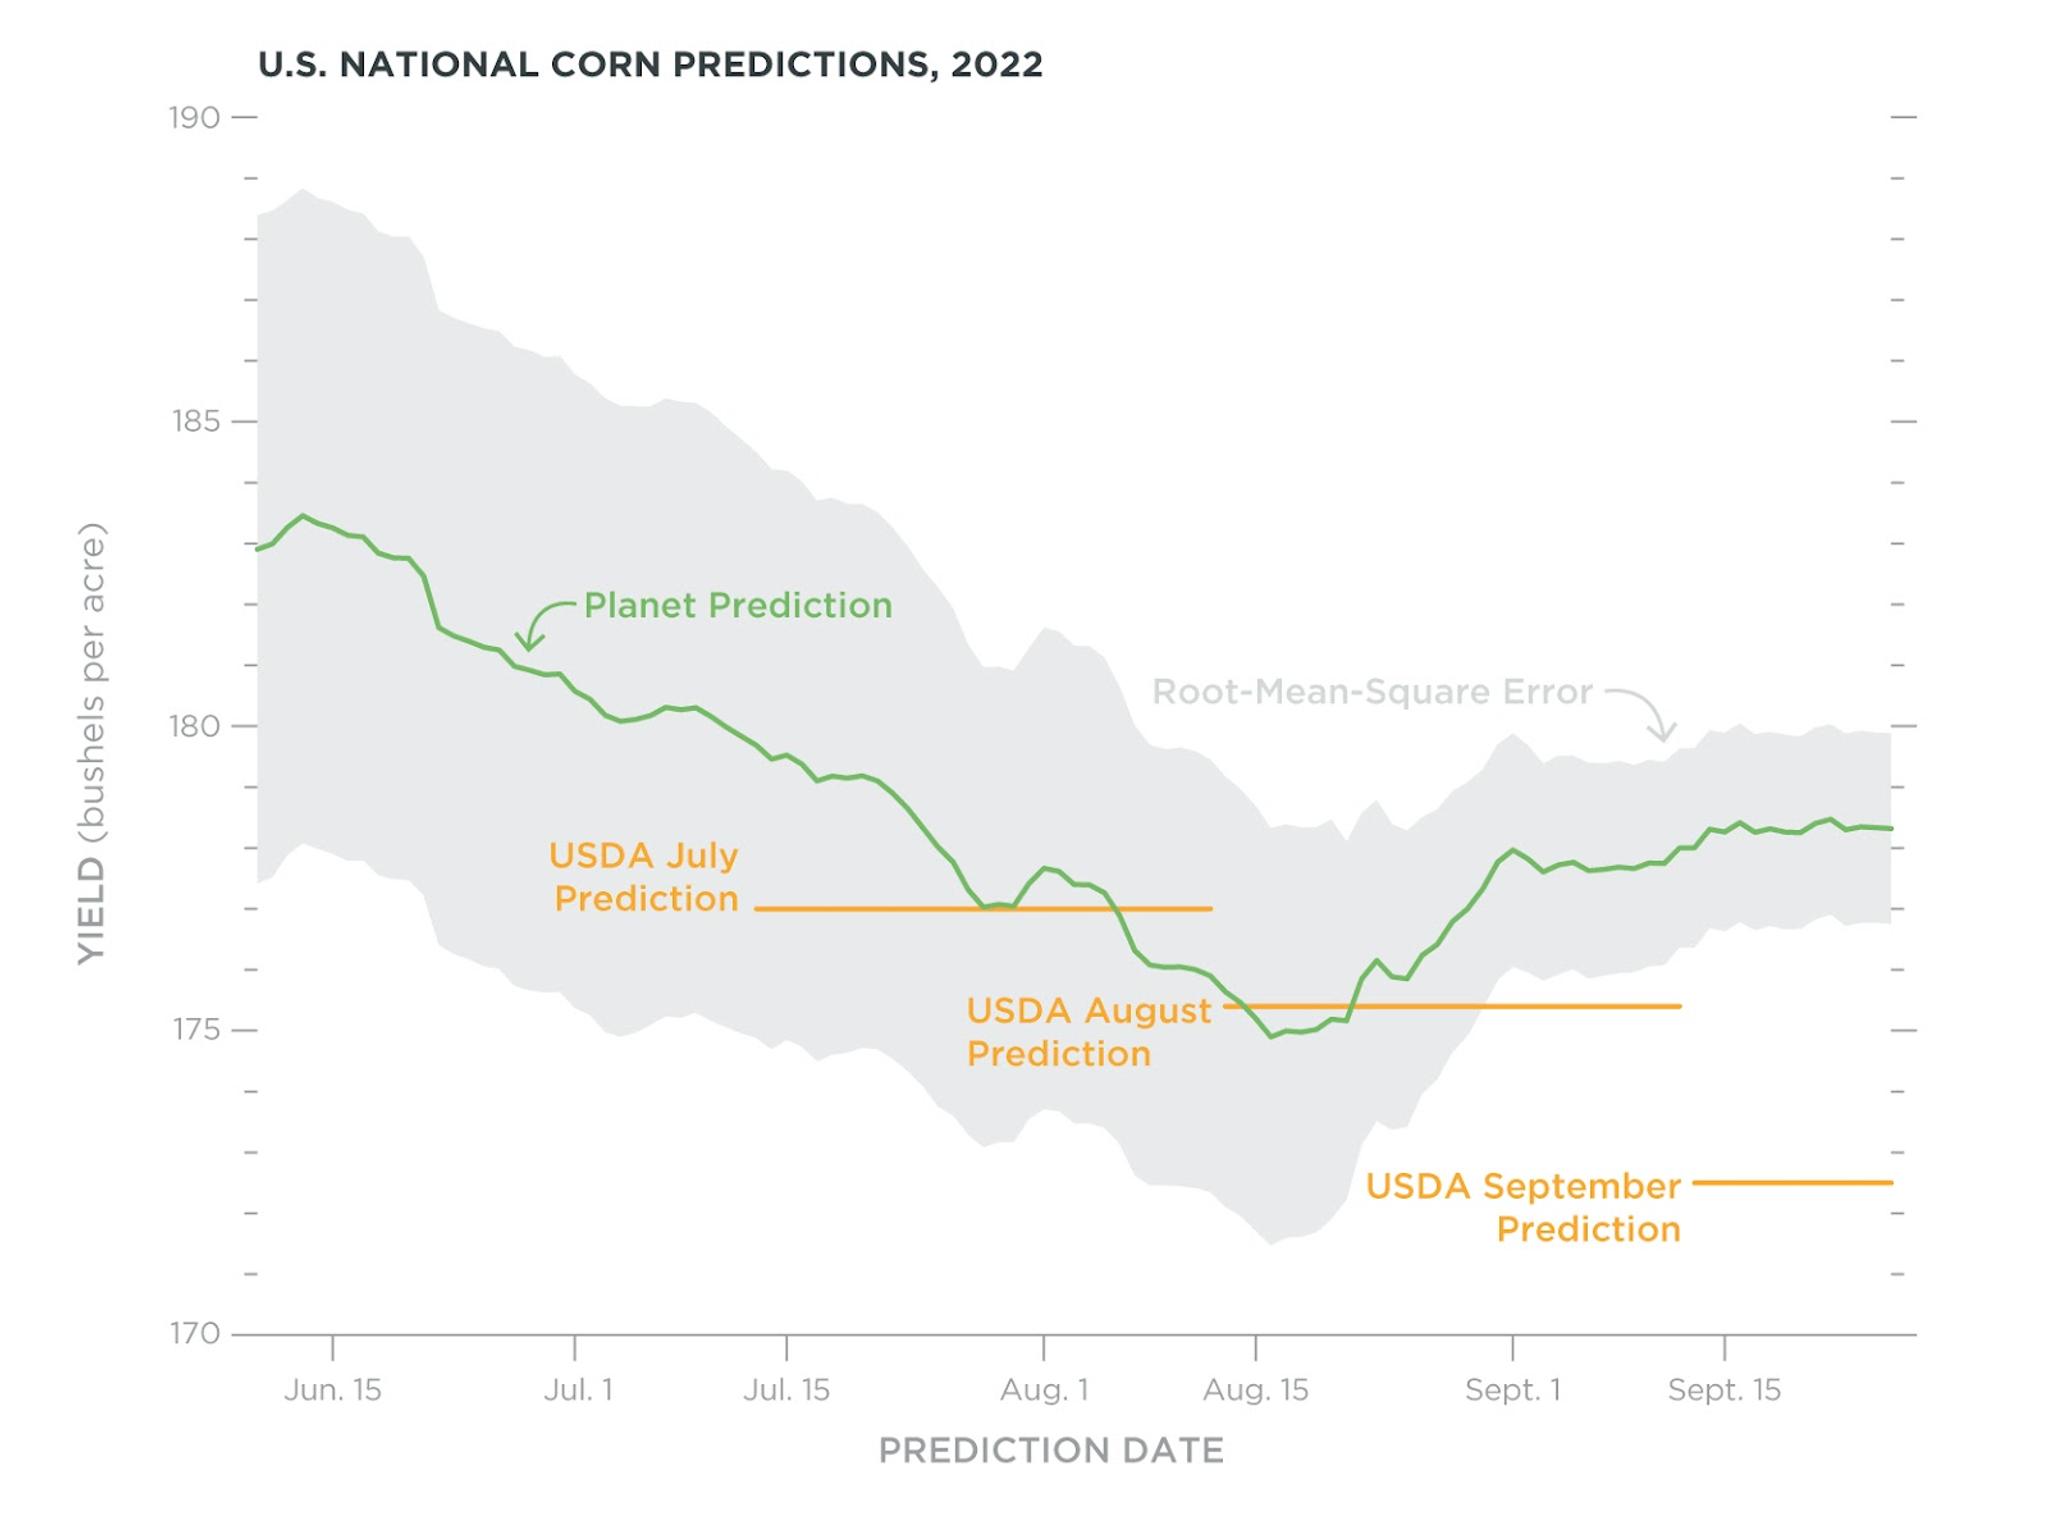
Figure 1a, Time series image of the US National 2022 corn prediction throughout the growing season. The root-mean-square error (rmse) is a measure of the model uncertainty, by calculating the mean absolute differences between the yield values predicted by the model and the final yield values for the historical runs of 2003-2021.
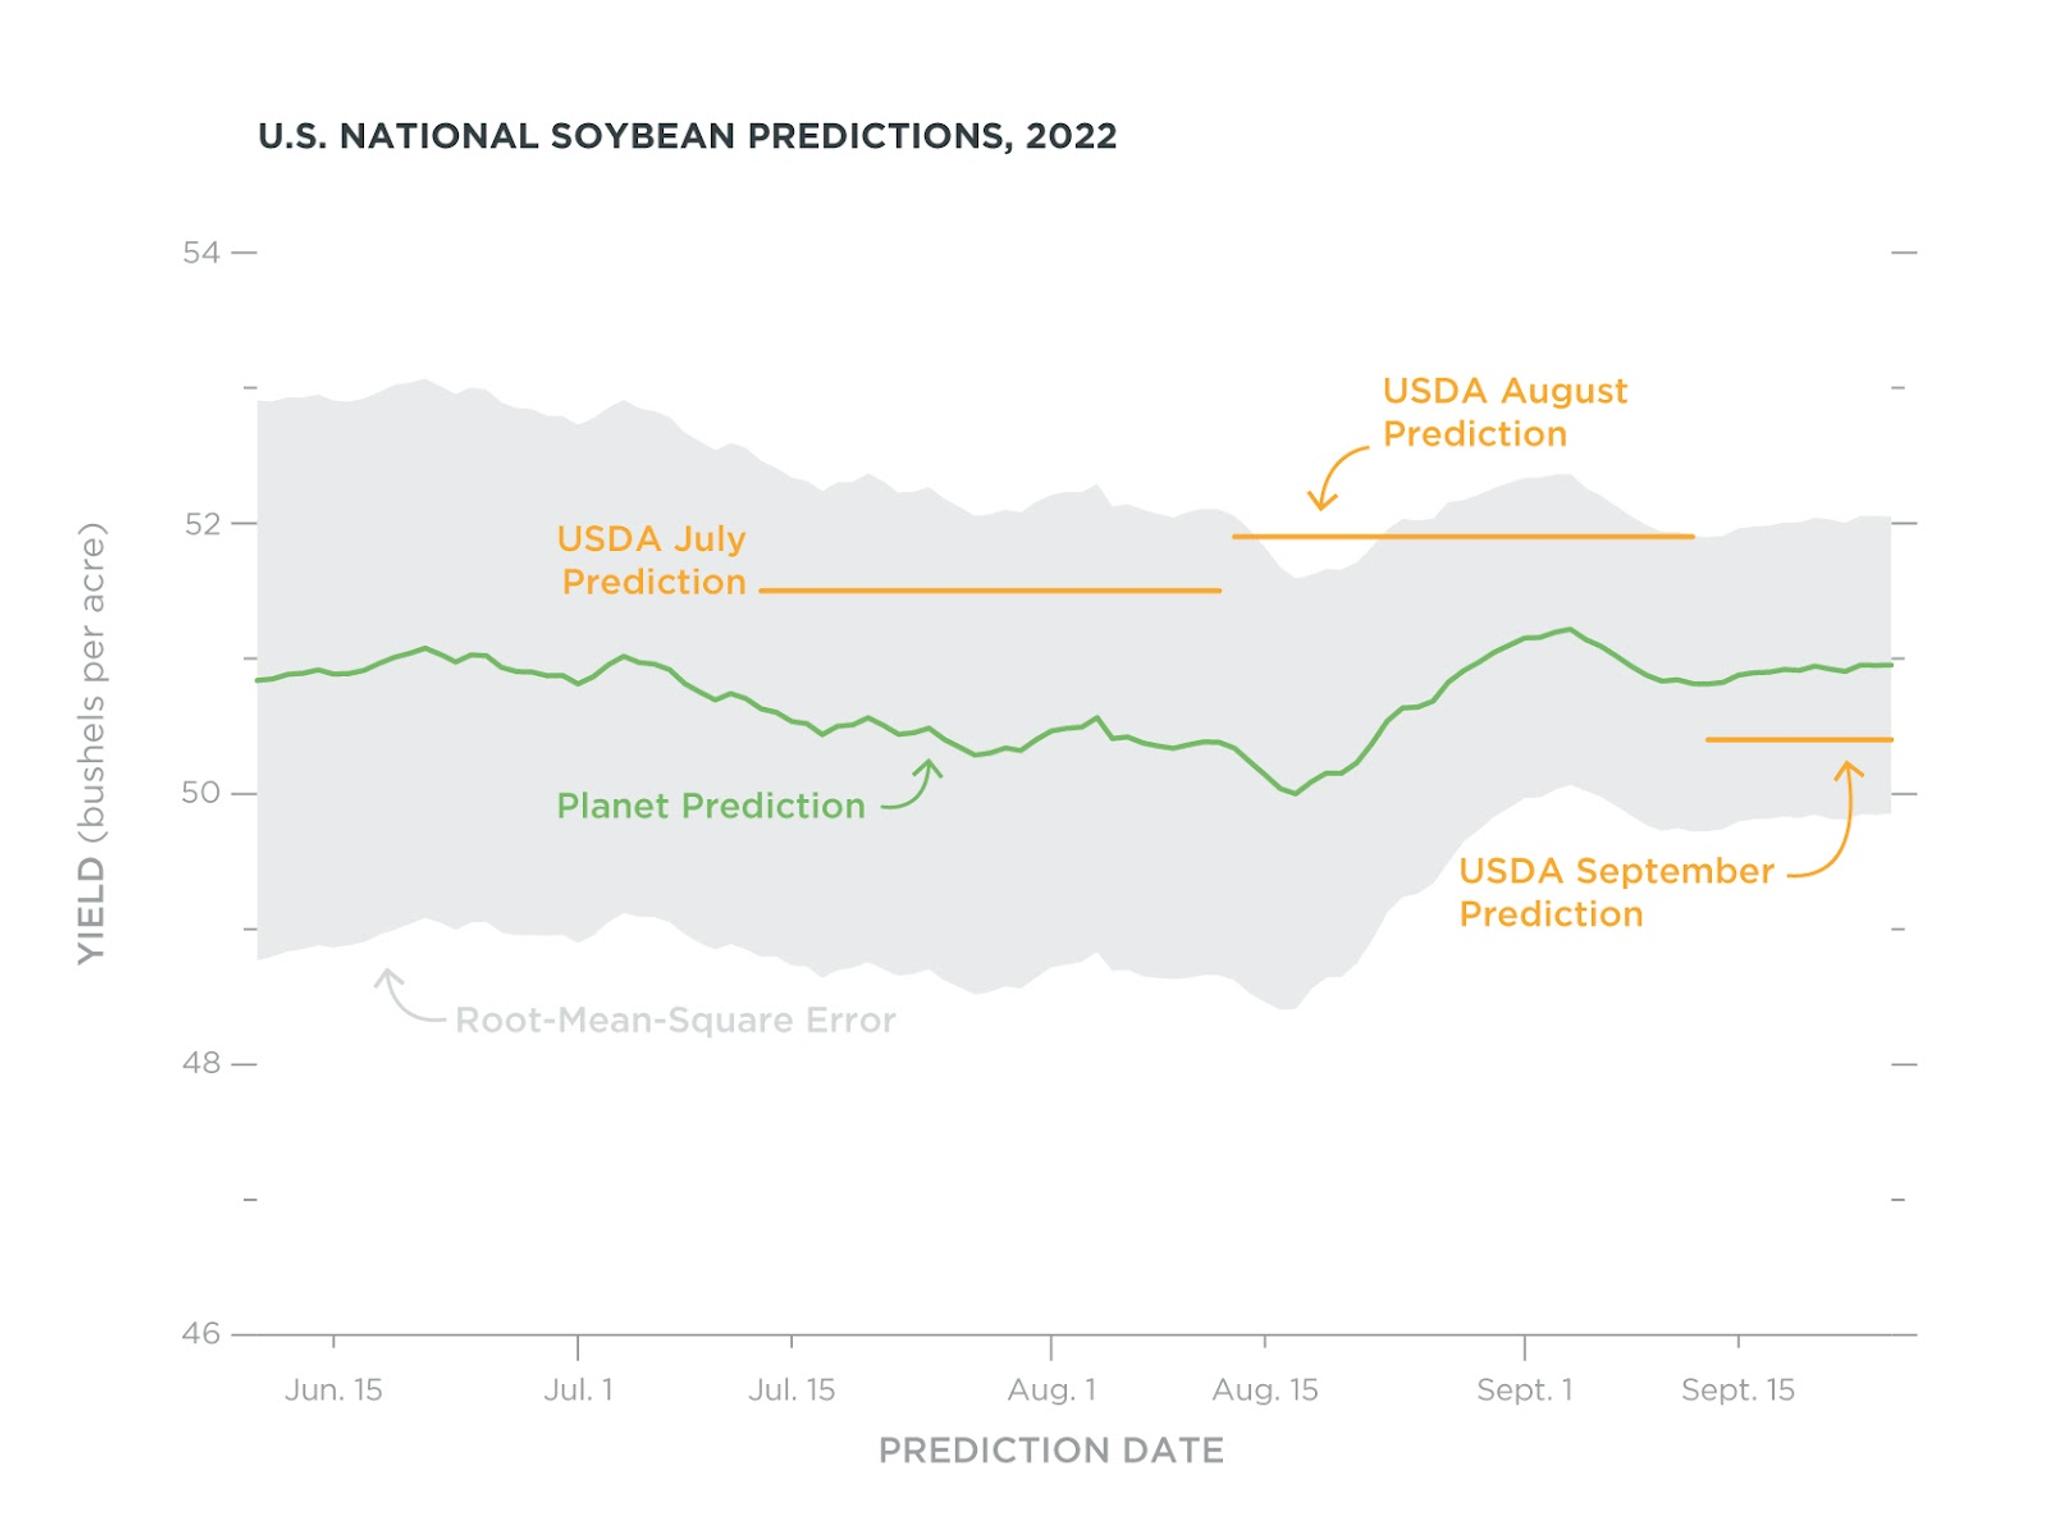
Figure 1b, Time series image of the US National 2022 soybeans prediction throughout the growing season.
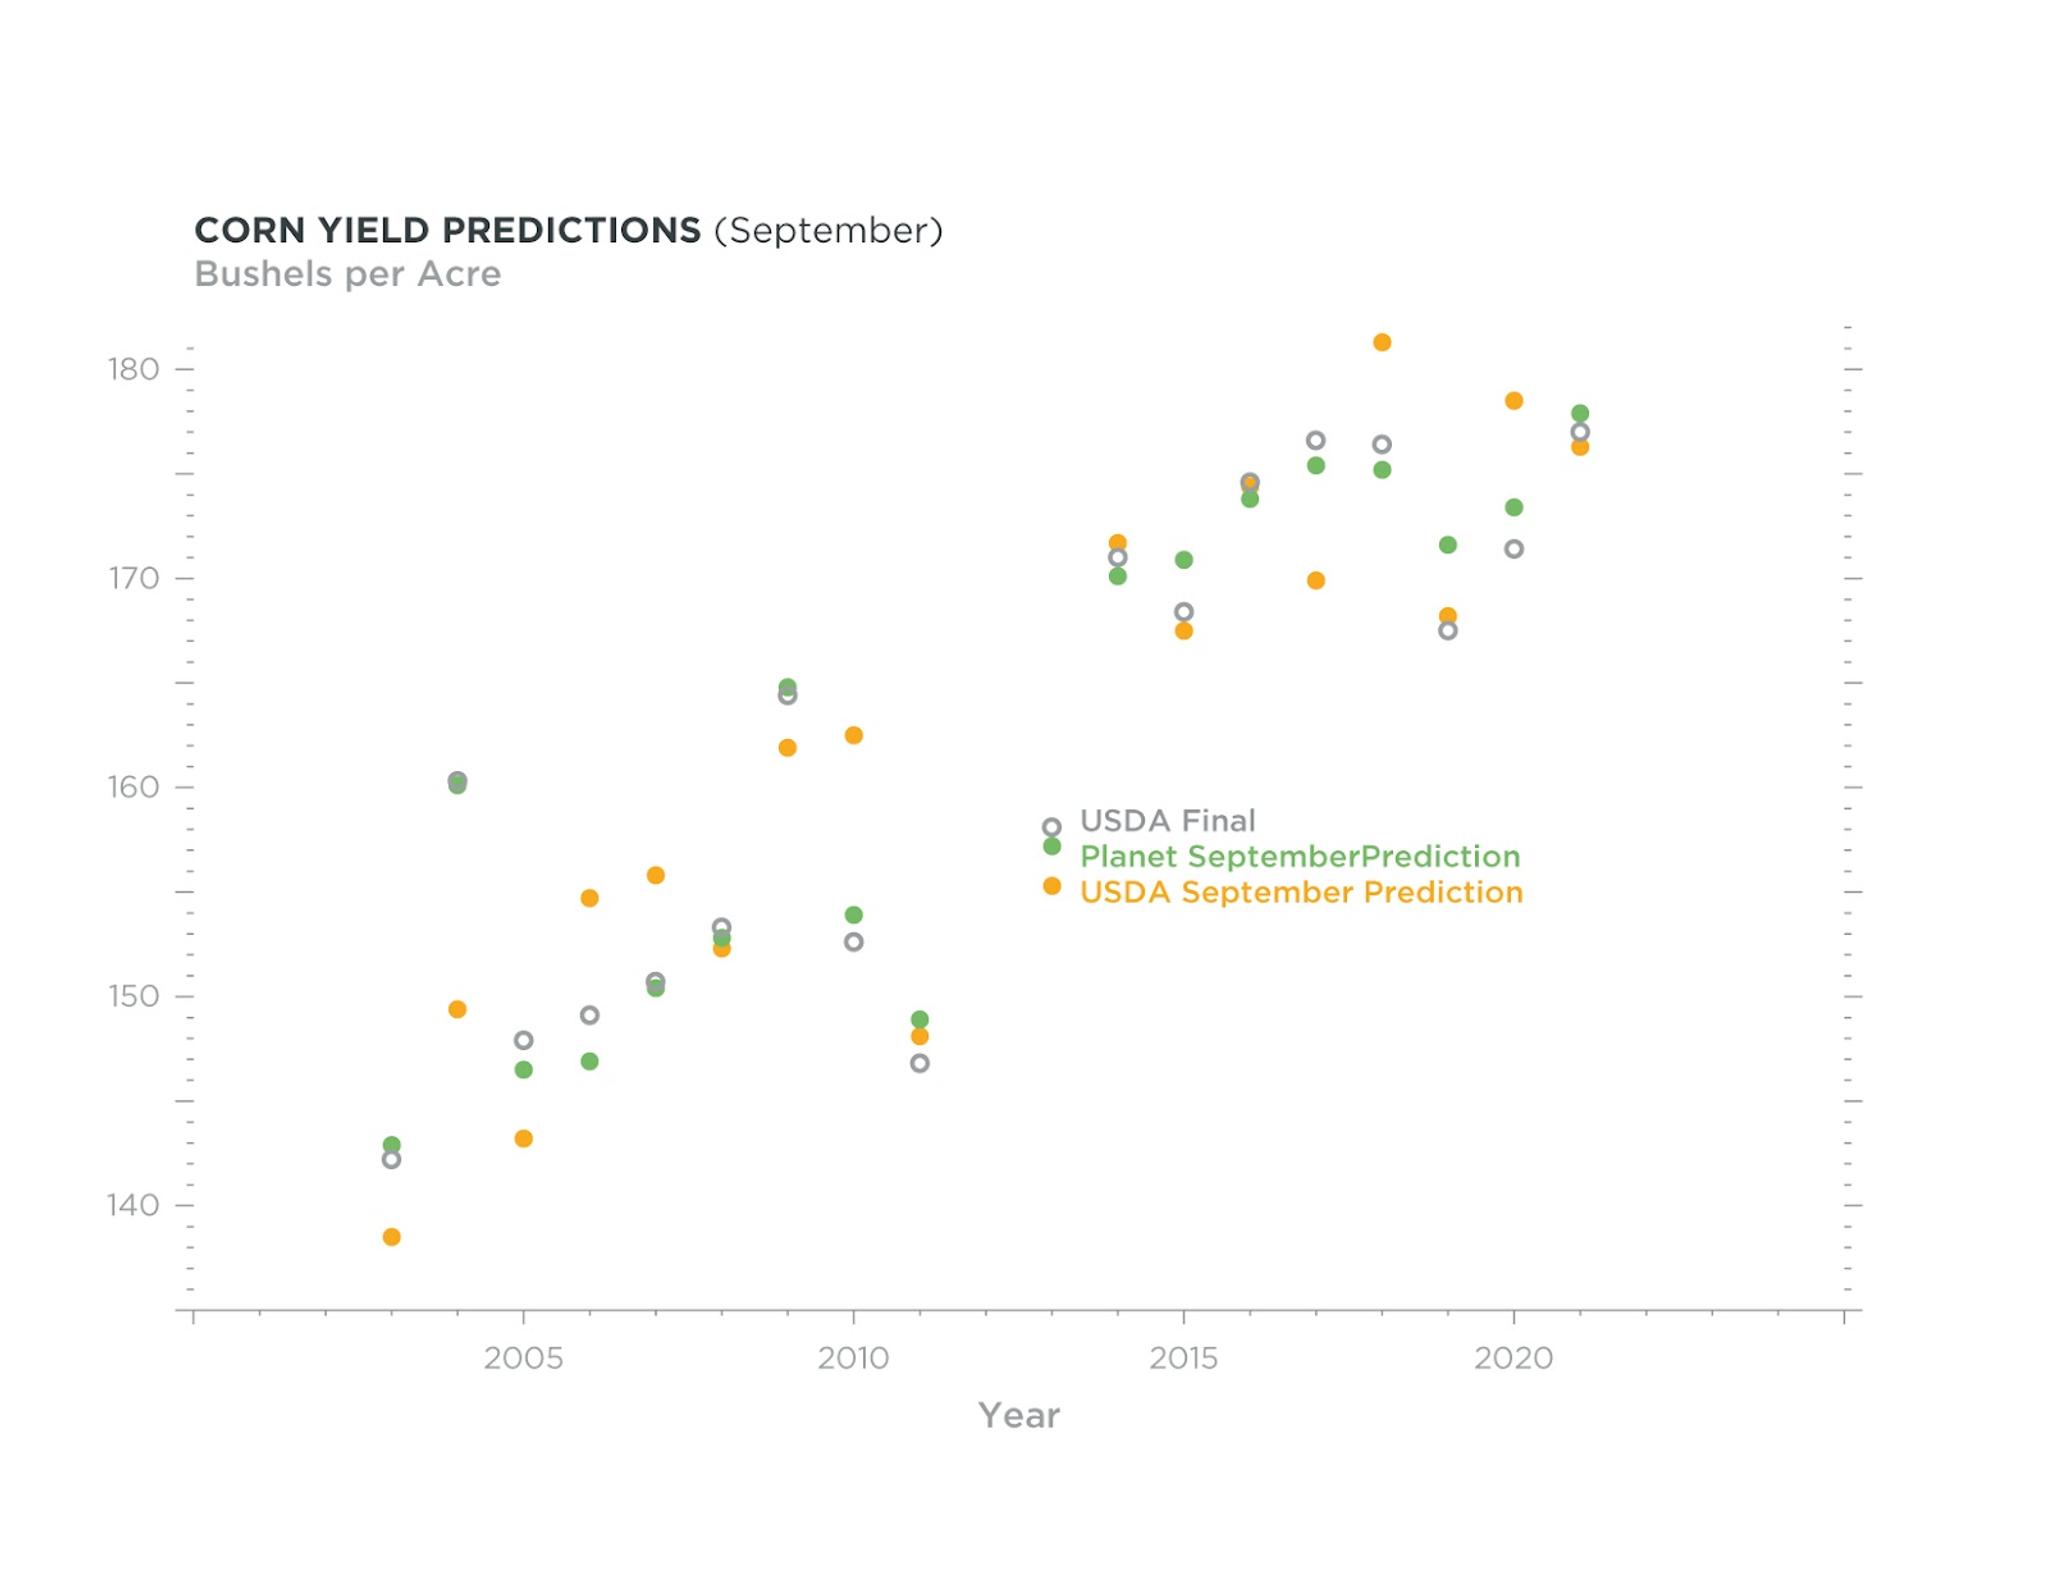
Figure 1c, US national corn yield forecasts in September from both Planet and the USDA, as compared to final yields.
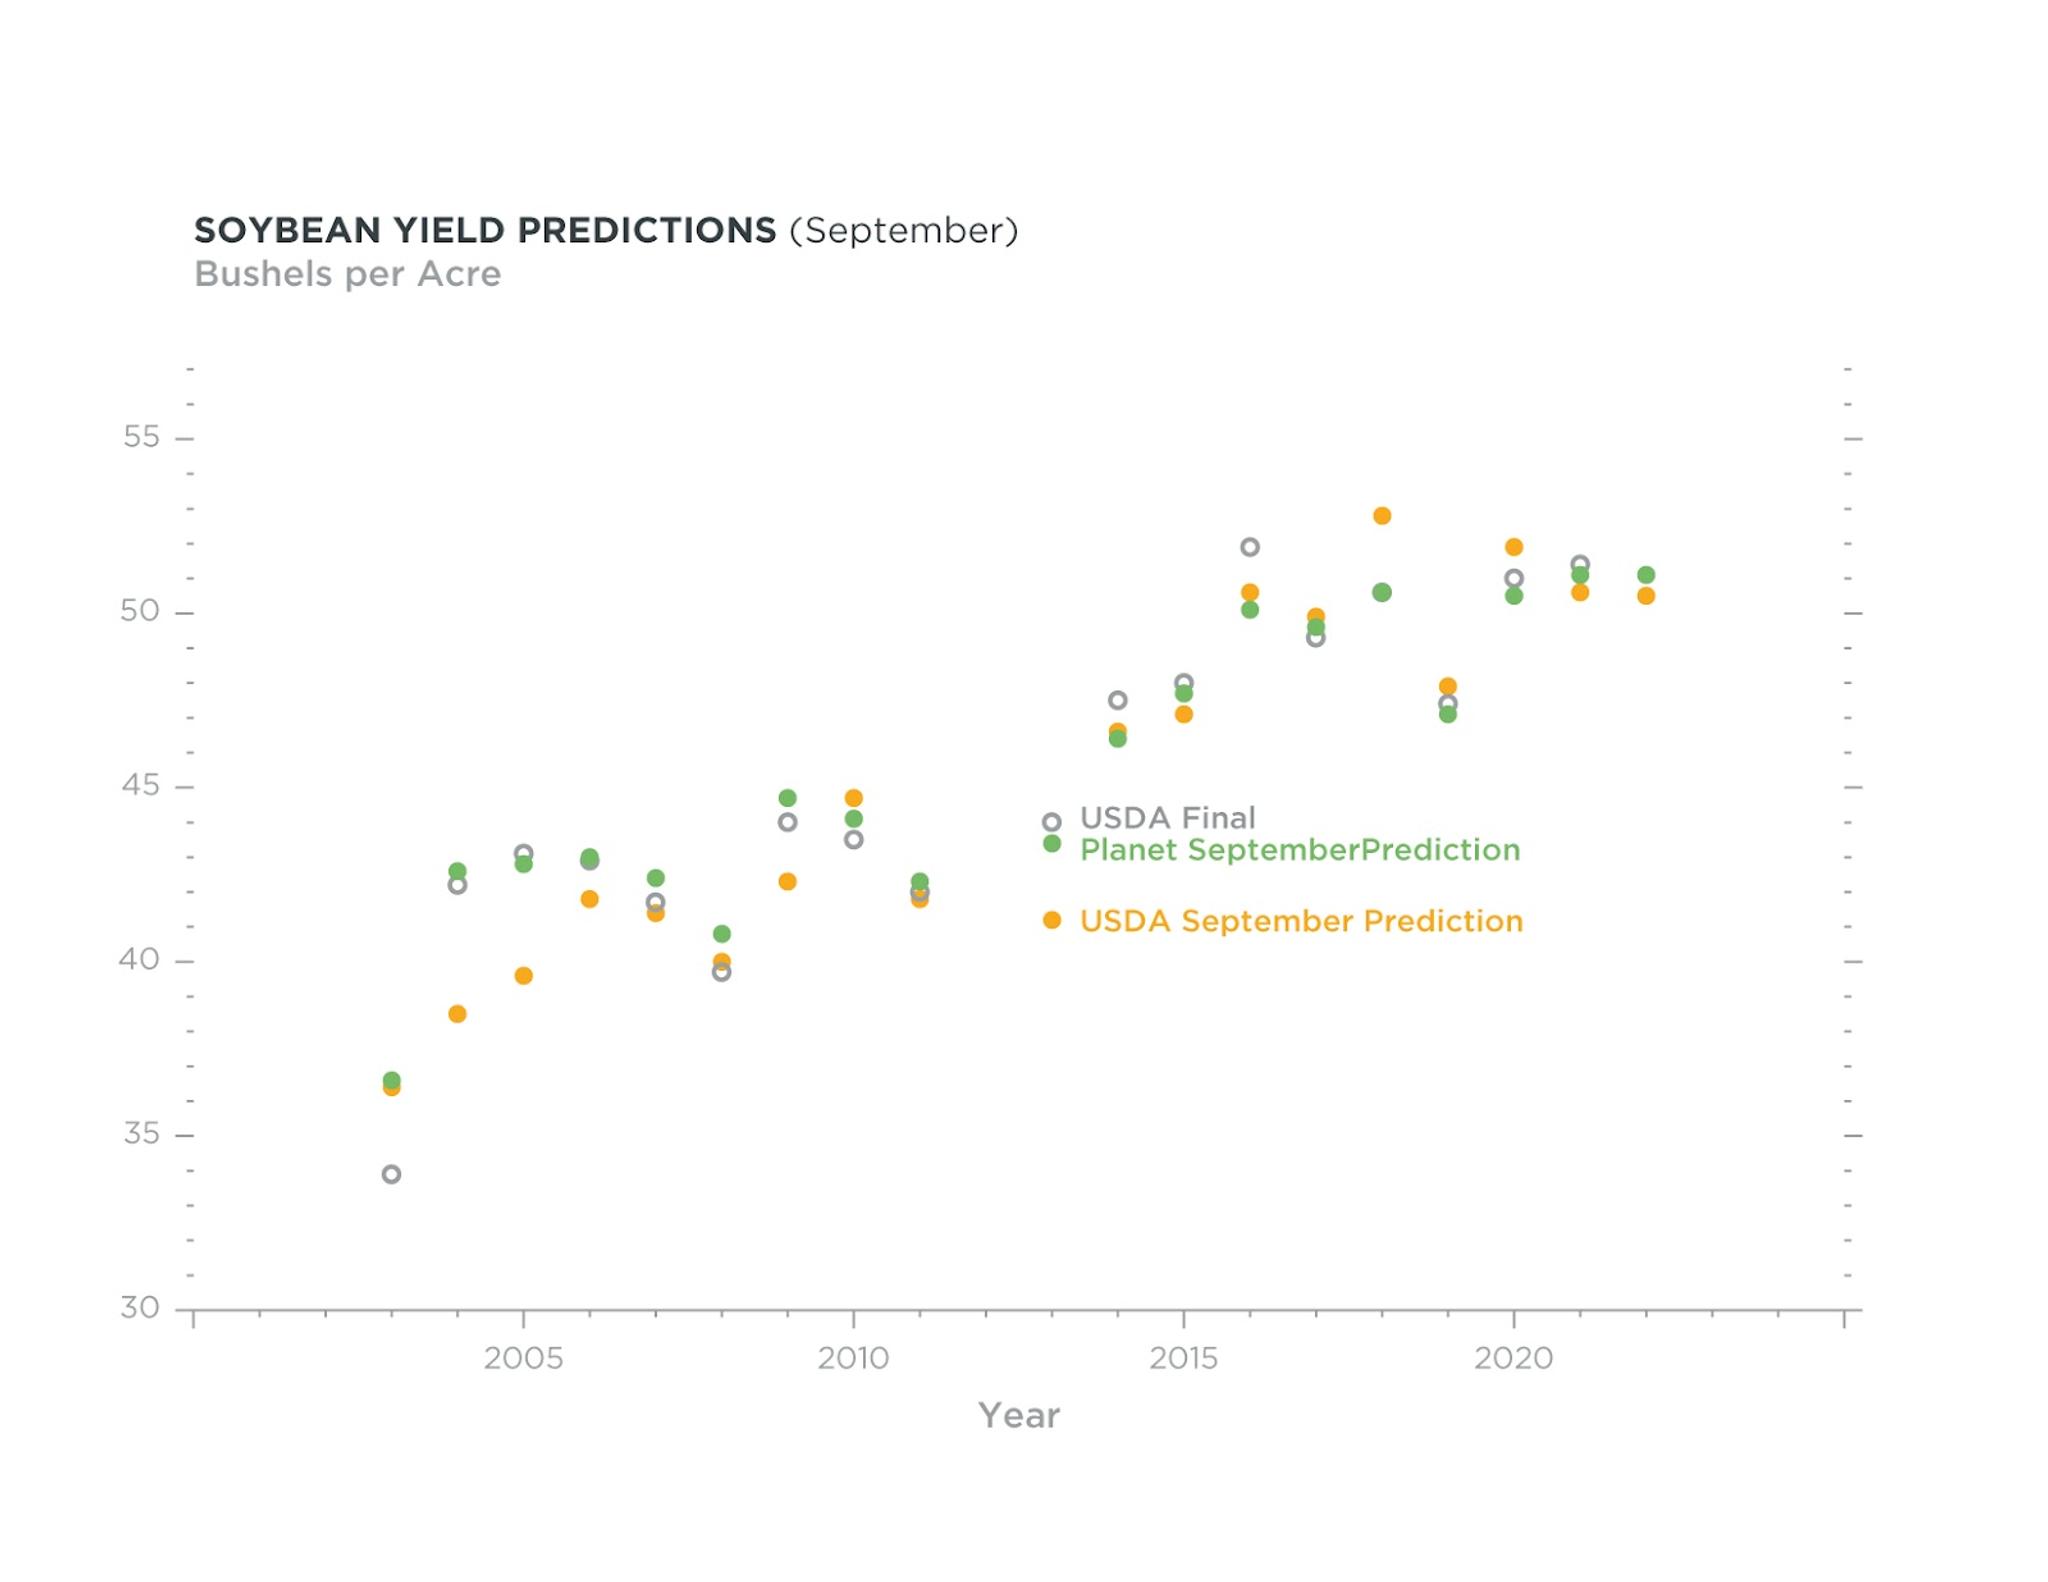
Figure 1d, US national soybeans yield forecasts in September from both Planet and the USDA, as compared to final yields.
Breaking down how yield forecasting works
To understand what might be behind these trends, it’s helpful to first understand the underlying data archive that powers our statistical forecasting model. These in-season U.S. national corn and soybeans yield forecasts are based on some of our unique set of remotely-sensed Planetary Variables including:
- Soil Water Content – A measurement of the volume of water contained in the first 5 cm of the soil
- Land Surface Temperature – A measurement of the radiative skin temperature of the surface of the earth at night time
- Vegetation Optical Depth – A microwave-based vegetation index related to the water content of vegetation, or simply, an indication of vegetation density
Next, let’s dig into the factors that influence our forecasts. We will have a deeper look at this year’s variability in the Planetary Variables over Illinois, one of the top producing states for corn and soybeans. Spring started with extraordinarily wet conditions, which can be seen from the Soil Water Content data (Fig. 2a). These conditions are highly unfavorable for farmers to begin planting activities, which caused a delayed start to the growing season – roughly about 15 days on average when looking at emergence data from the USDA over the same state (Fig. 2d). This emergence data describes the percentage of the newly planted crops that are emerging from the soil.
Although the delay does not necessarily lead to lower crop yields, it can increase the risk of issues with drought, heat, and harvesting later in the season. It also increases the uncertainty of all currently available forecasts, since the growing season is up to half a month behind on years with early emergence.
Here’s what differentiates Planet’s Yield Forecasting solution from others: because of its 20-year historical archive, it can provide corollary insights into this uncertainty over time (see Fig. 1) and in space (Fig. 3). This ultimately helps agronomists and economists see long-standing trends to support well-balanced decision making vs. overreacting to short-term weather events.
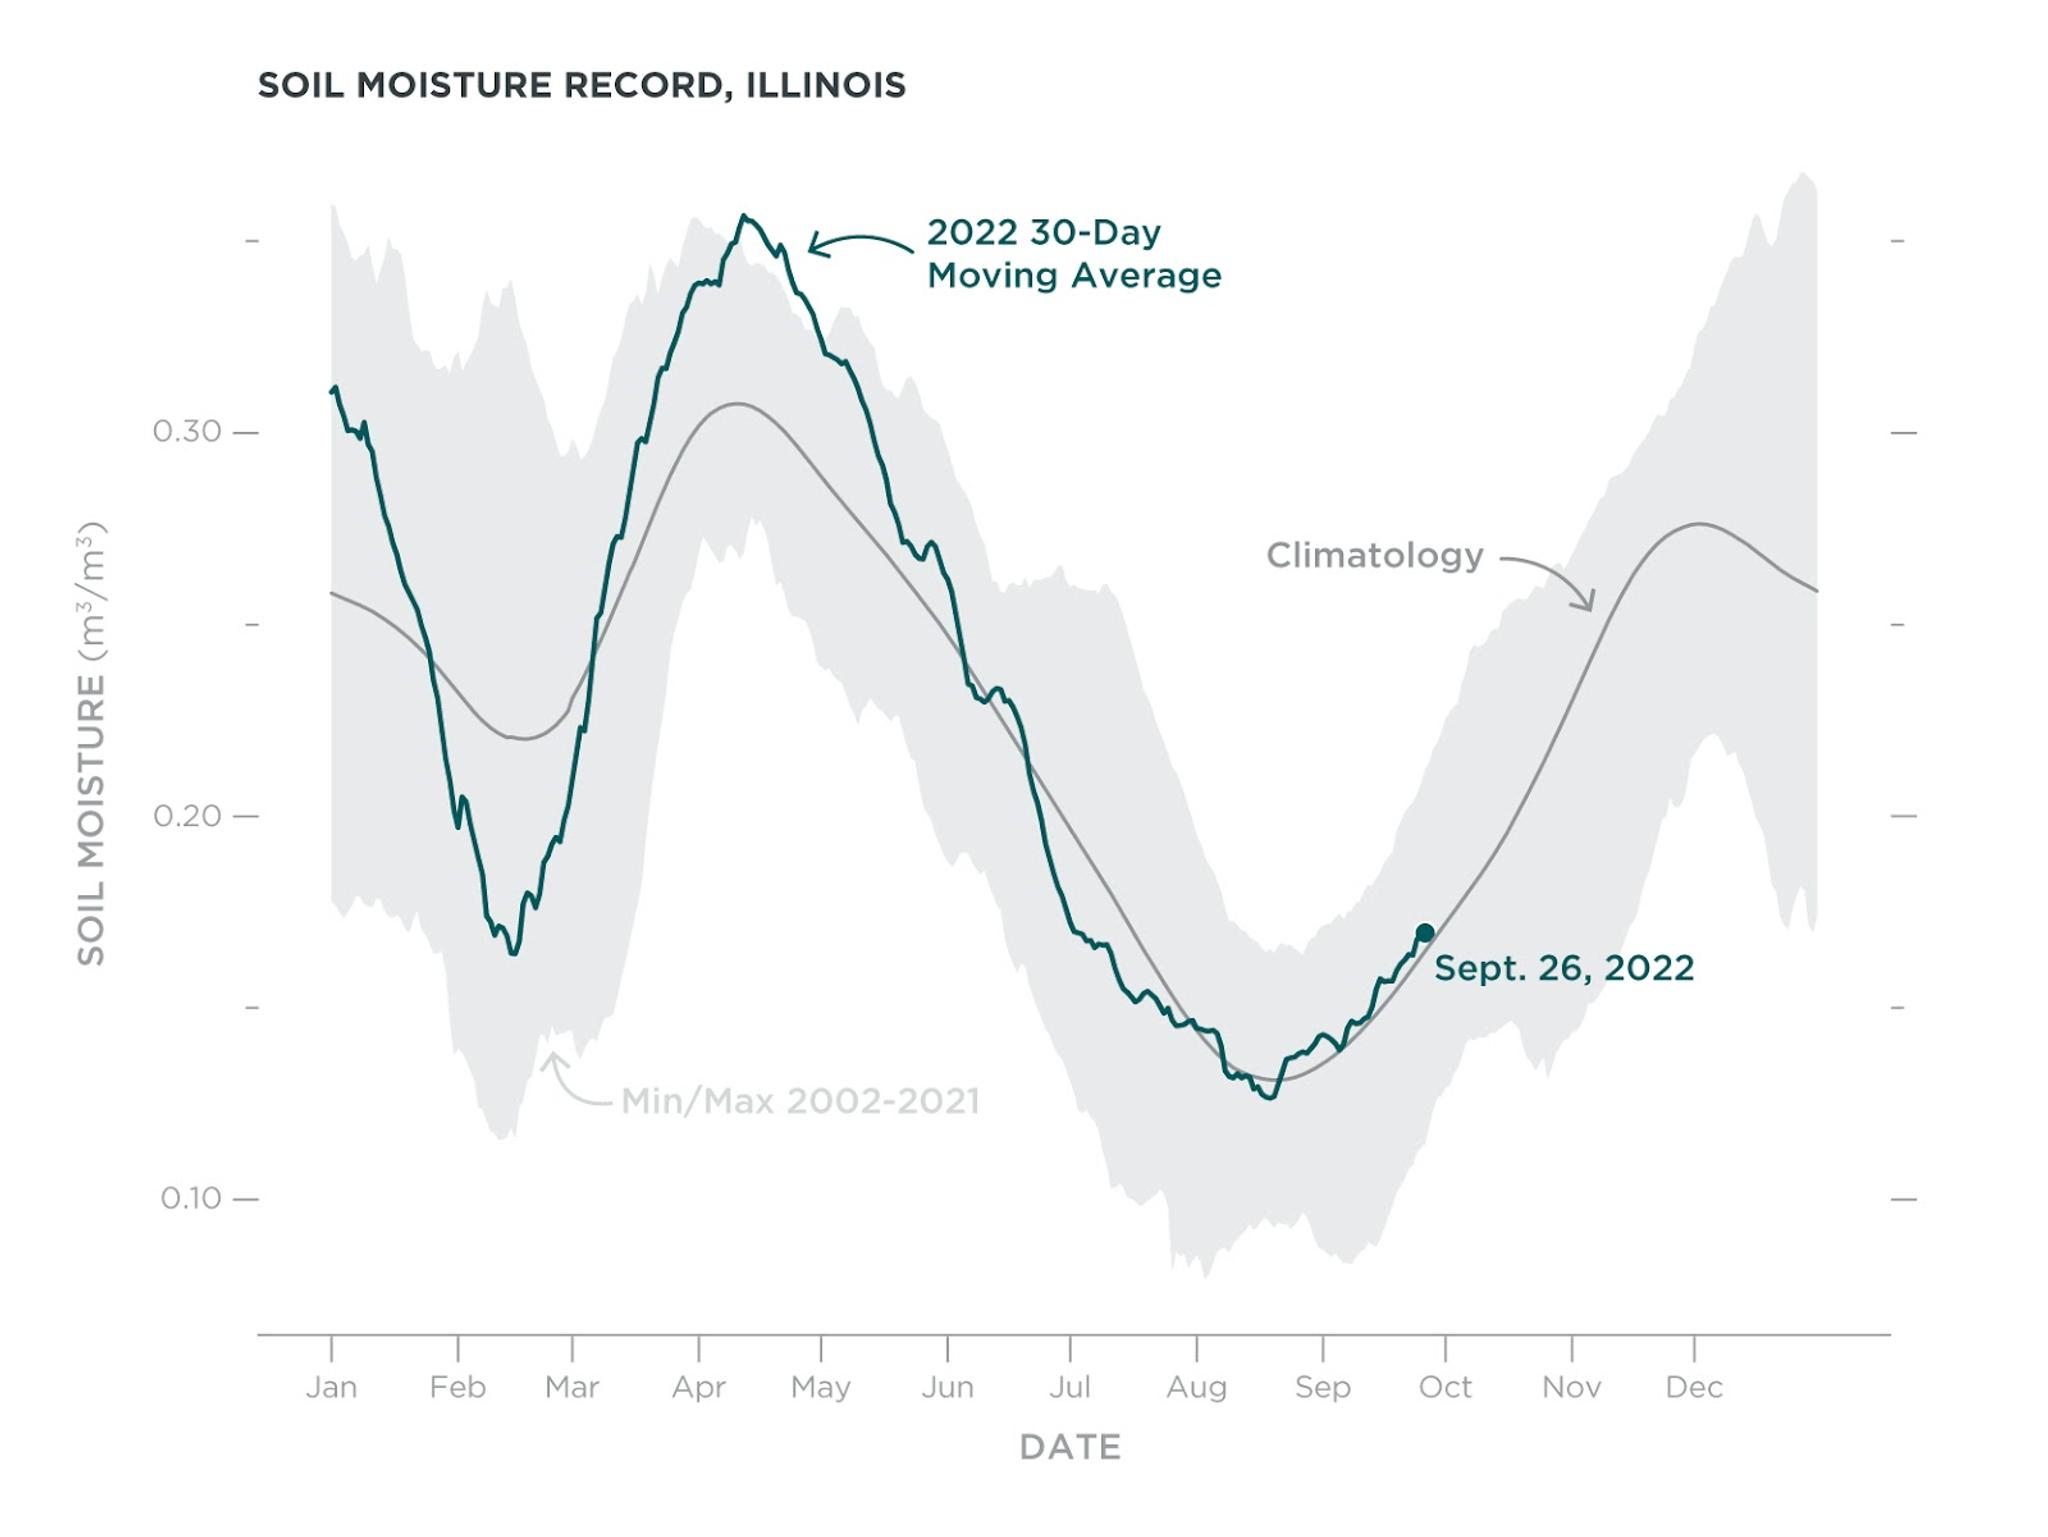
Figure 2a, Time series image of Soil Water Content in Illinois, showing an extraordinary wet period in early spring of 2022.
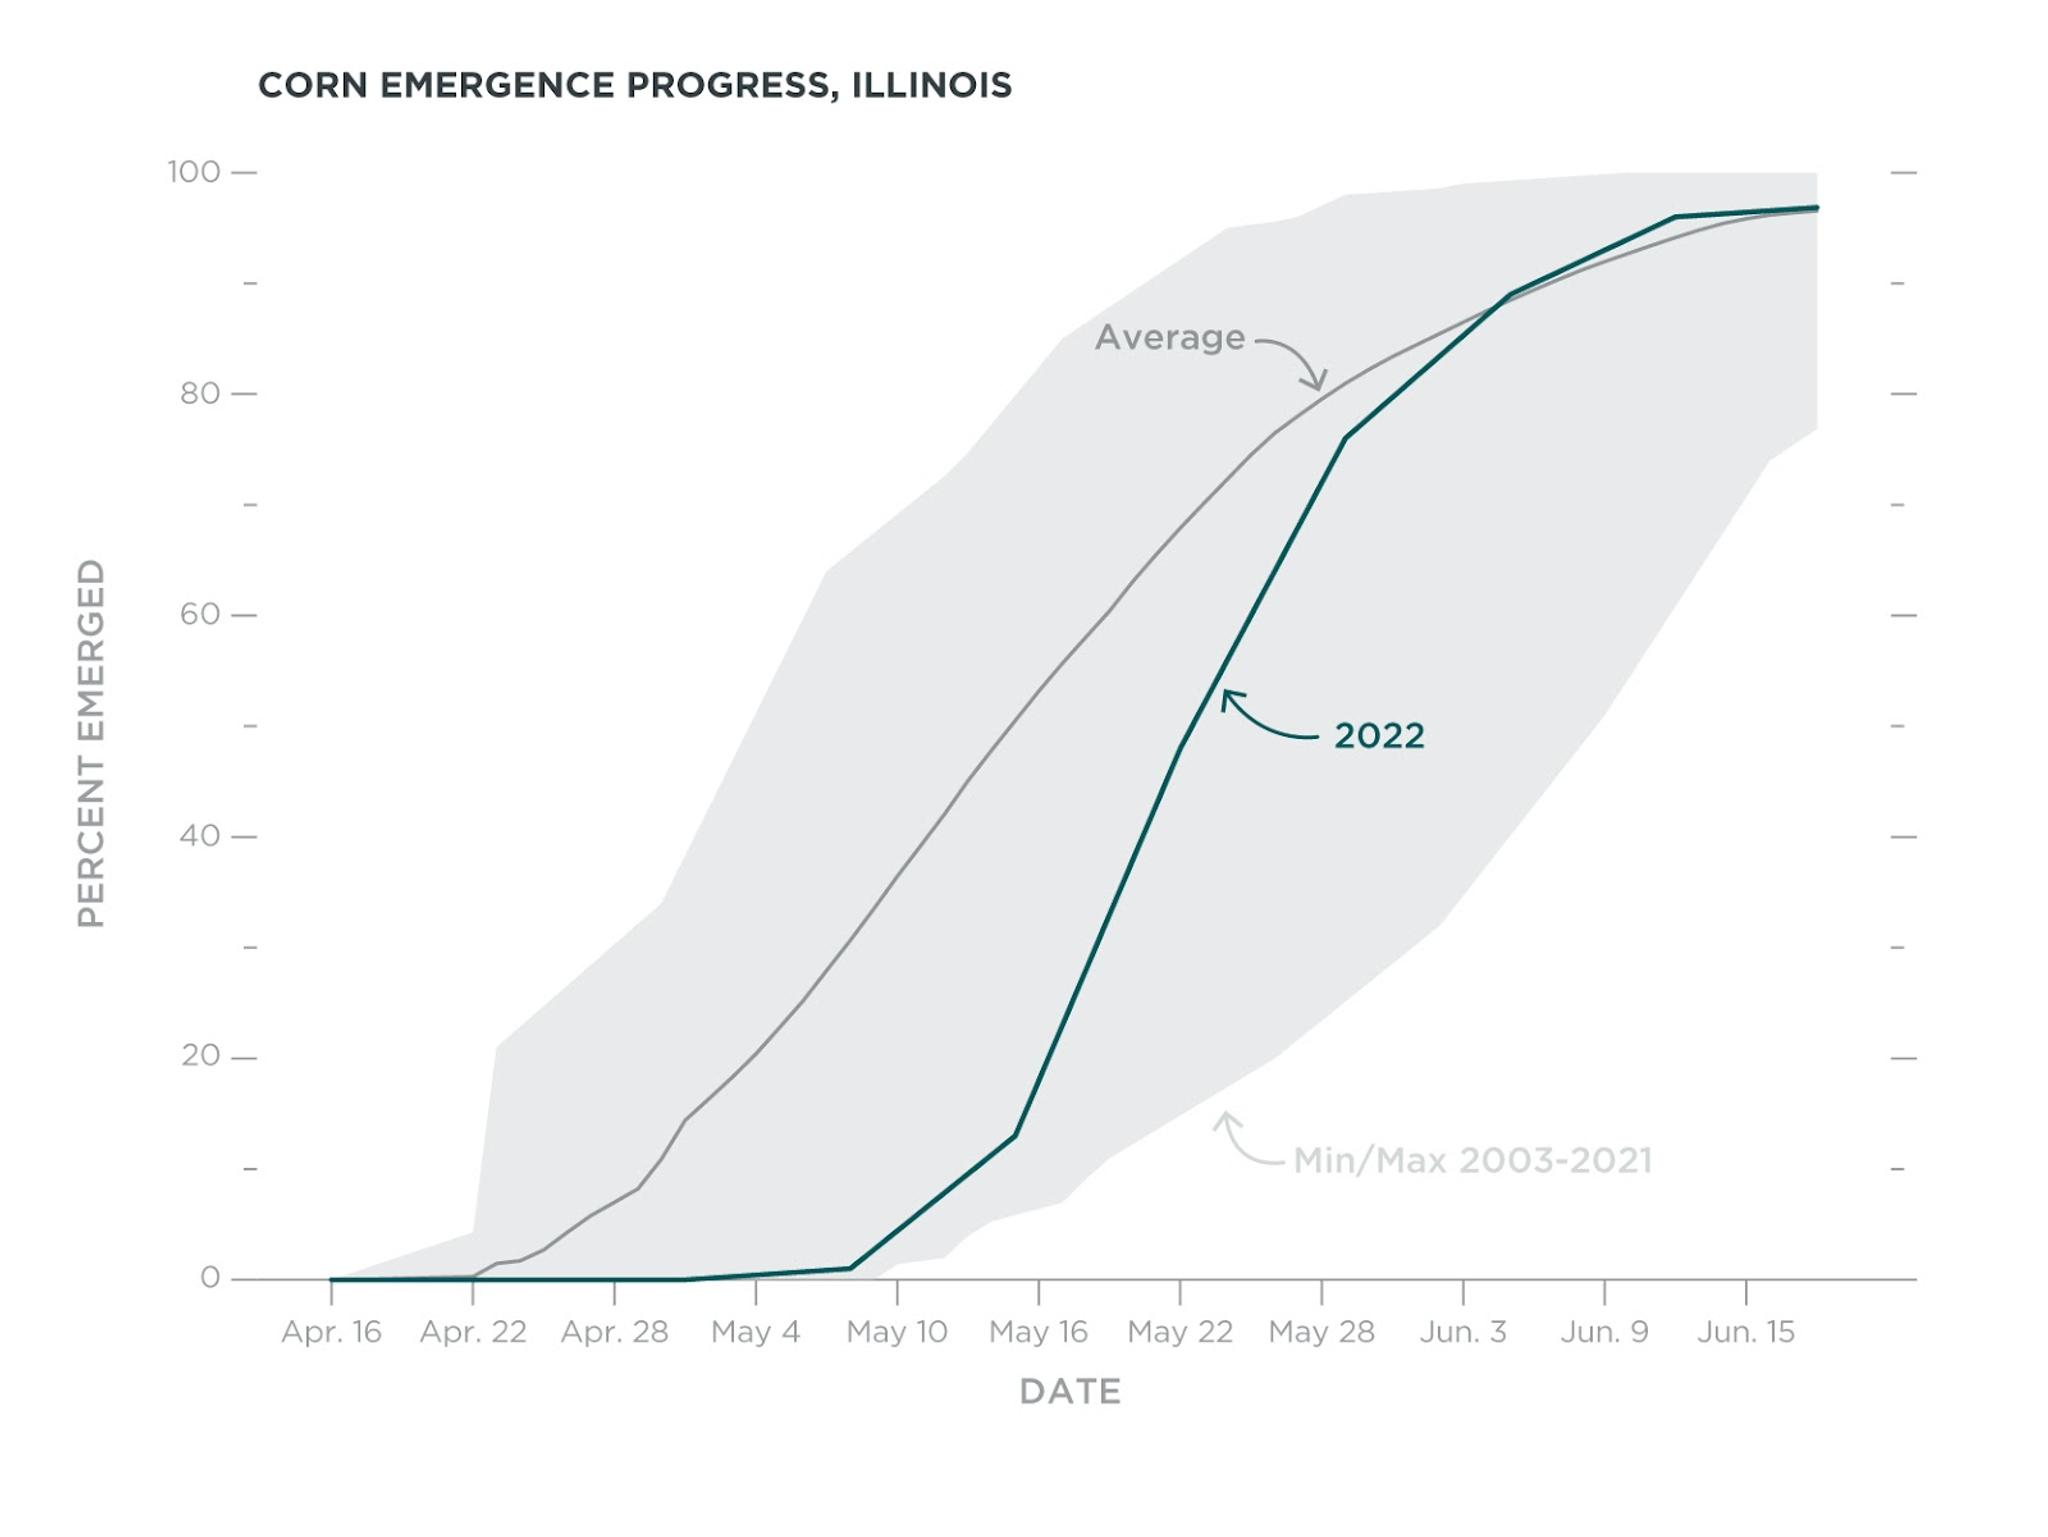
Figure 2d, USDA emergence dates in Illinois, with a clear lag for 2022 in the start of the season.
After the late emergence, the crops experienced a widespread heatwave in June that can be seen in our Land Surface Temperature data (Fig. 2b), combined with reduced precipitation. This is an unwelcome combination that resembles the patterns of 2012, a year that experienced record-low yields. While luckily some relief was seen afterwards, with more favorable weather conditions in many regions, it is difficult to say what the exact impact of this will be on the crop yields. However, what we do see in the Soil Water Content is that the wet conditions early in the season potentially provided a valuable buffer during the summer heatwave.
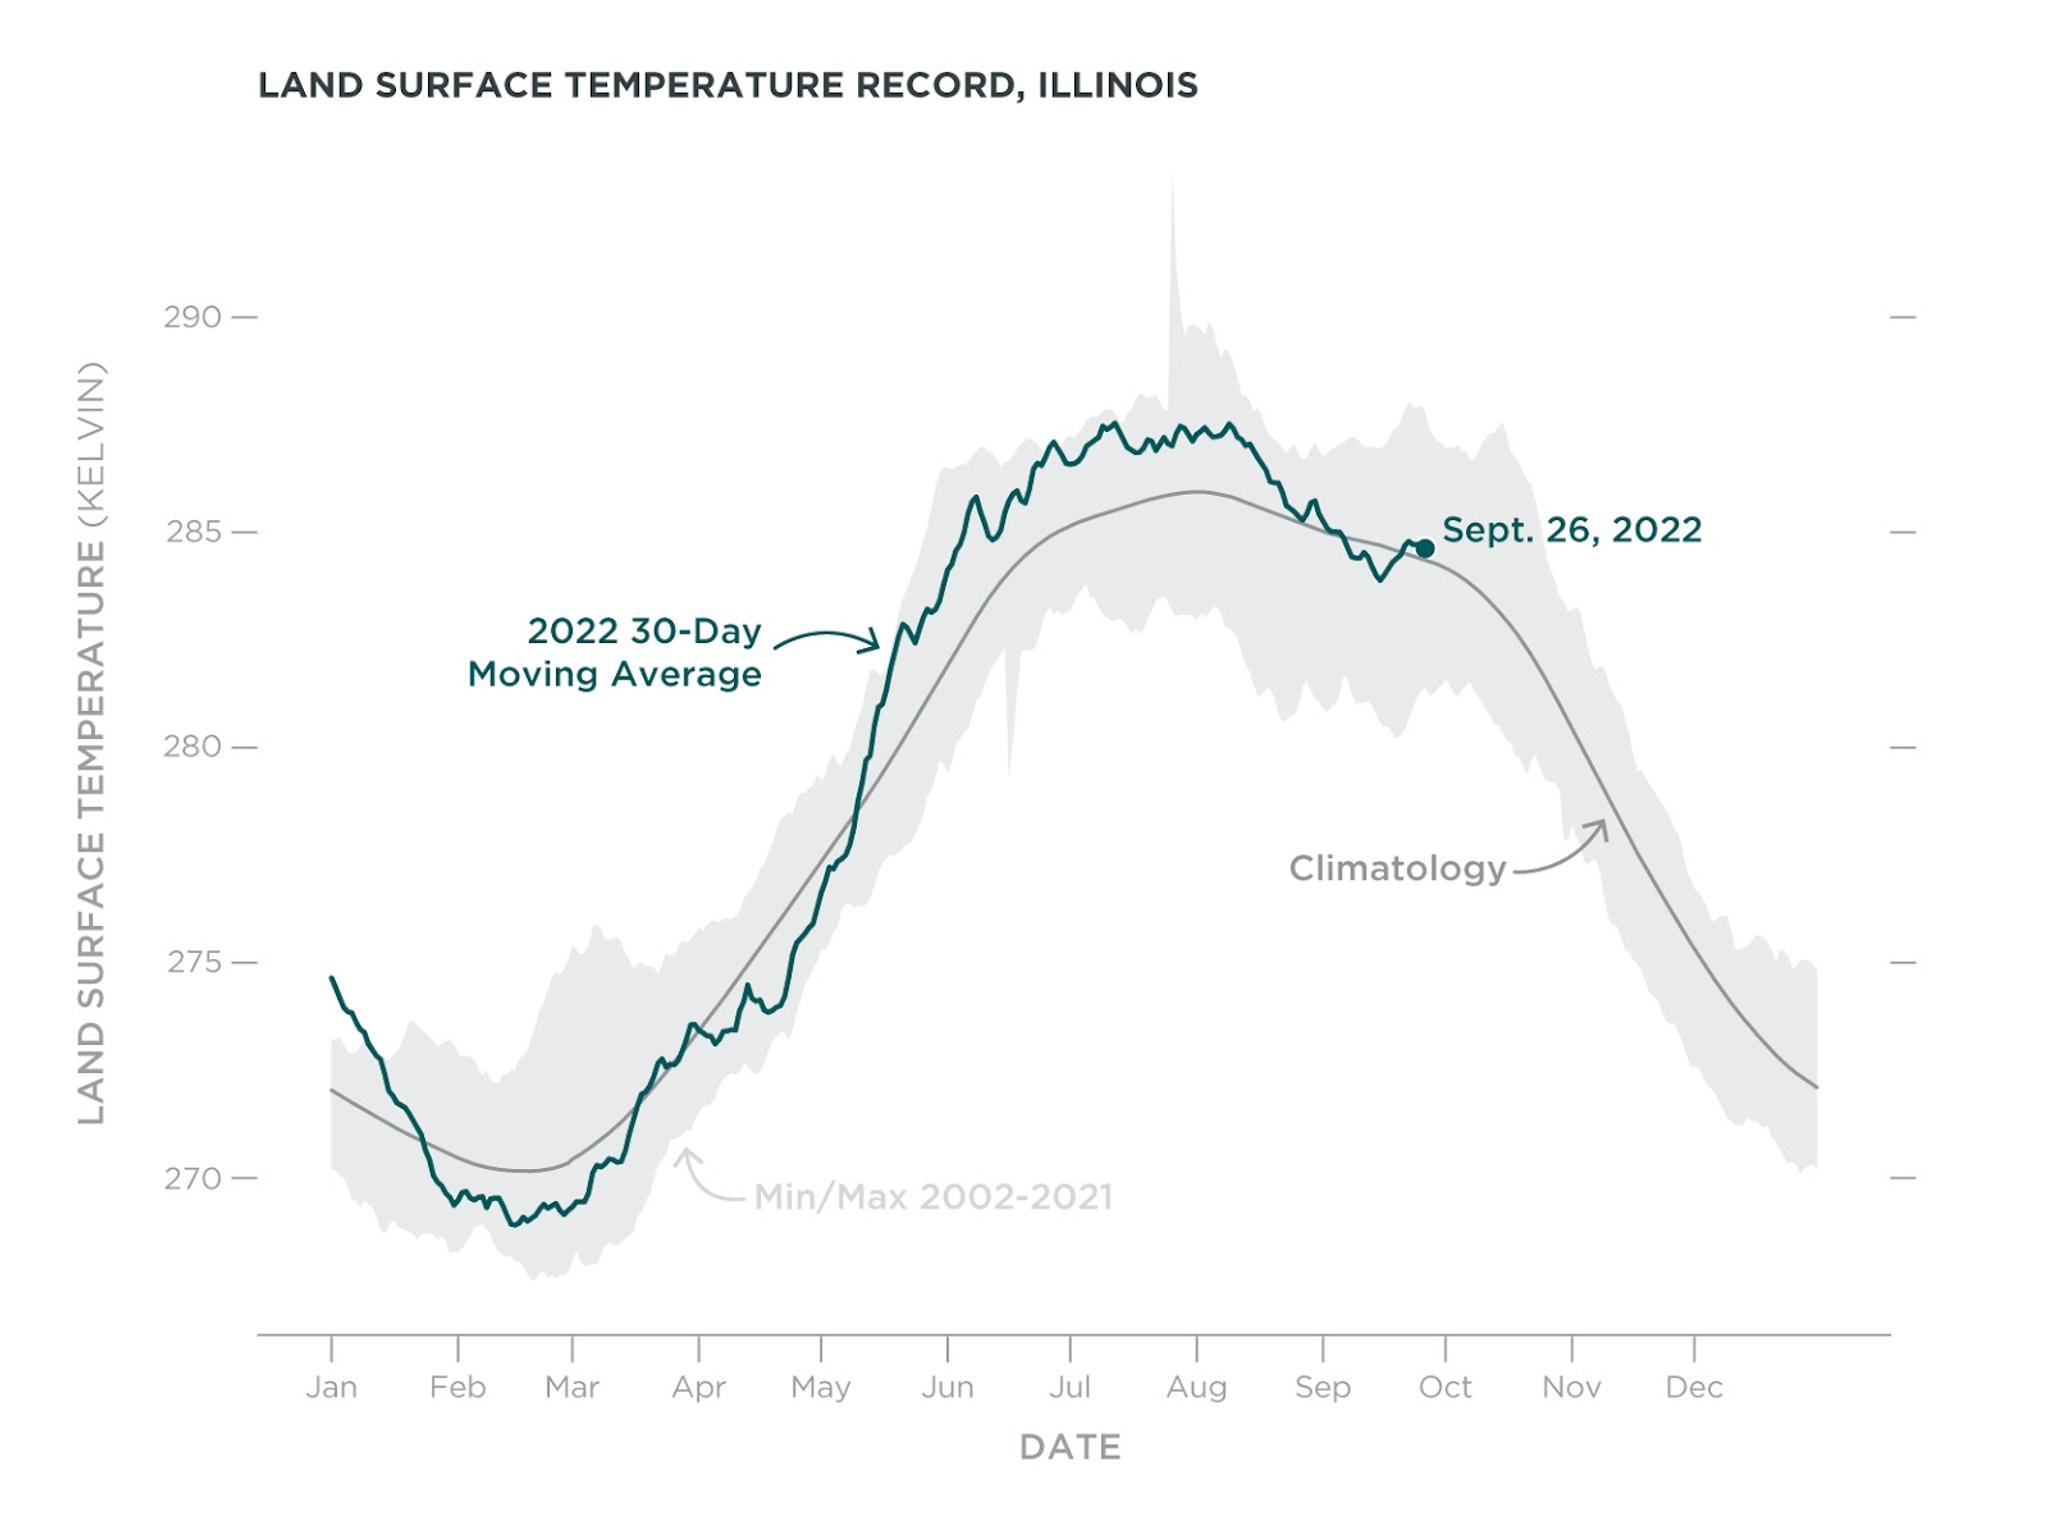
Figure 2b, Time series image of the nighttime Land Surface Temperature in Illinois, showing a sustained period of high anomalies in 2022 from the second half of May up to early August.
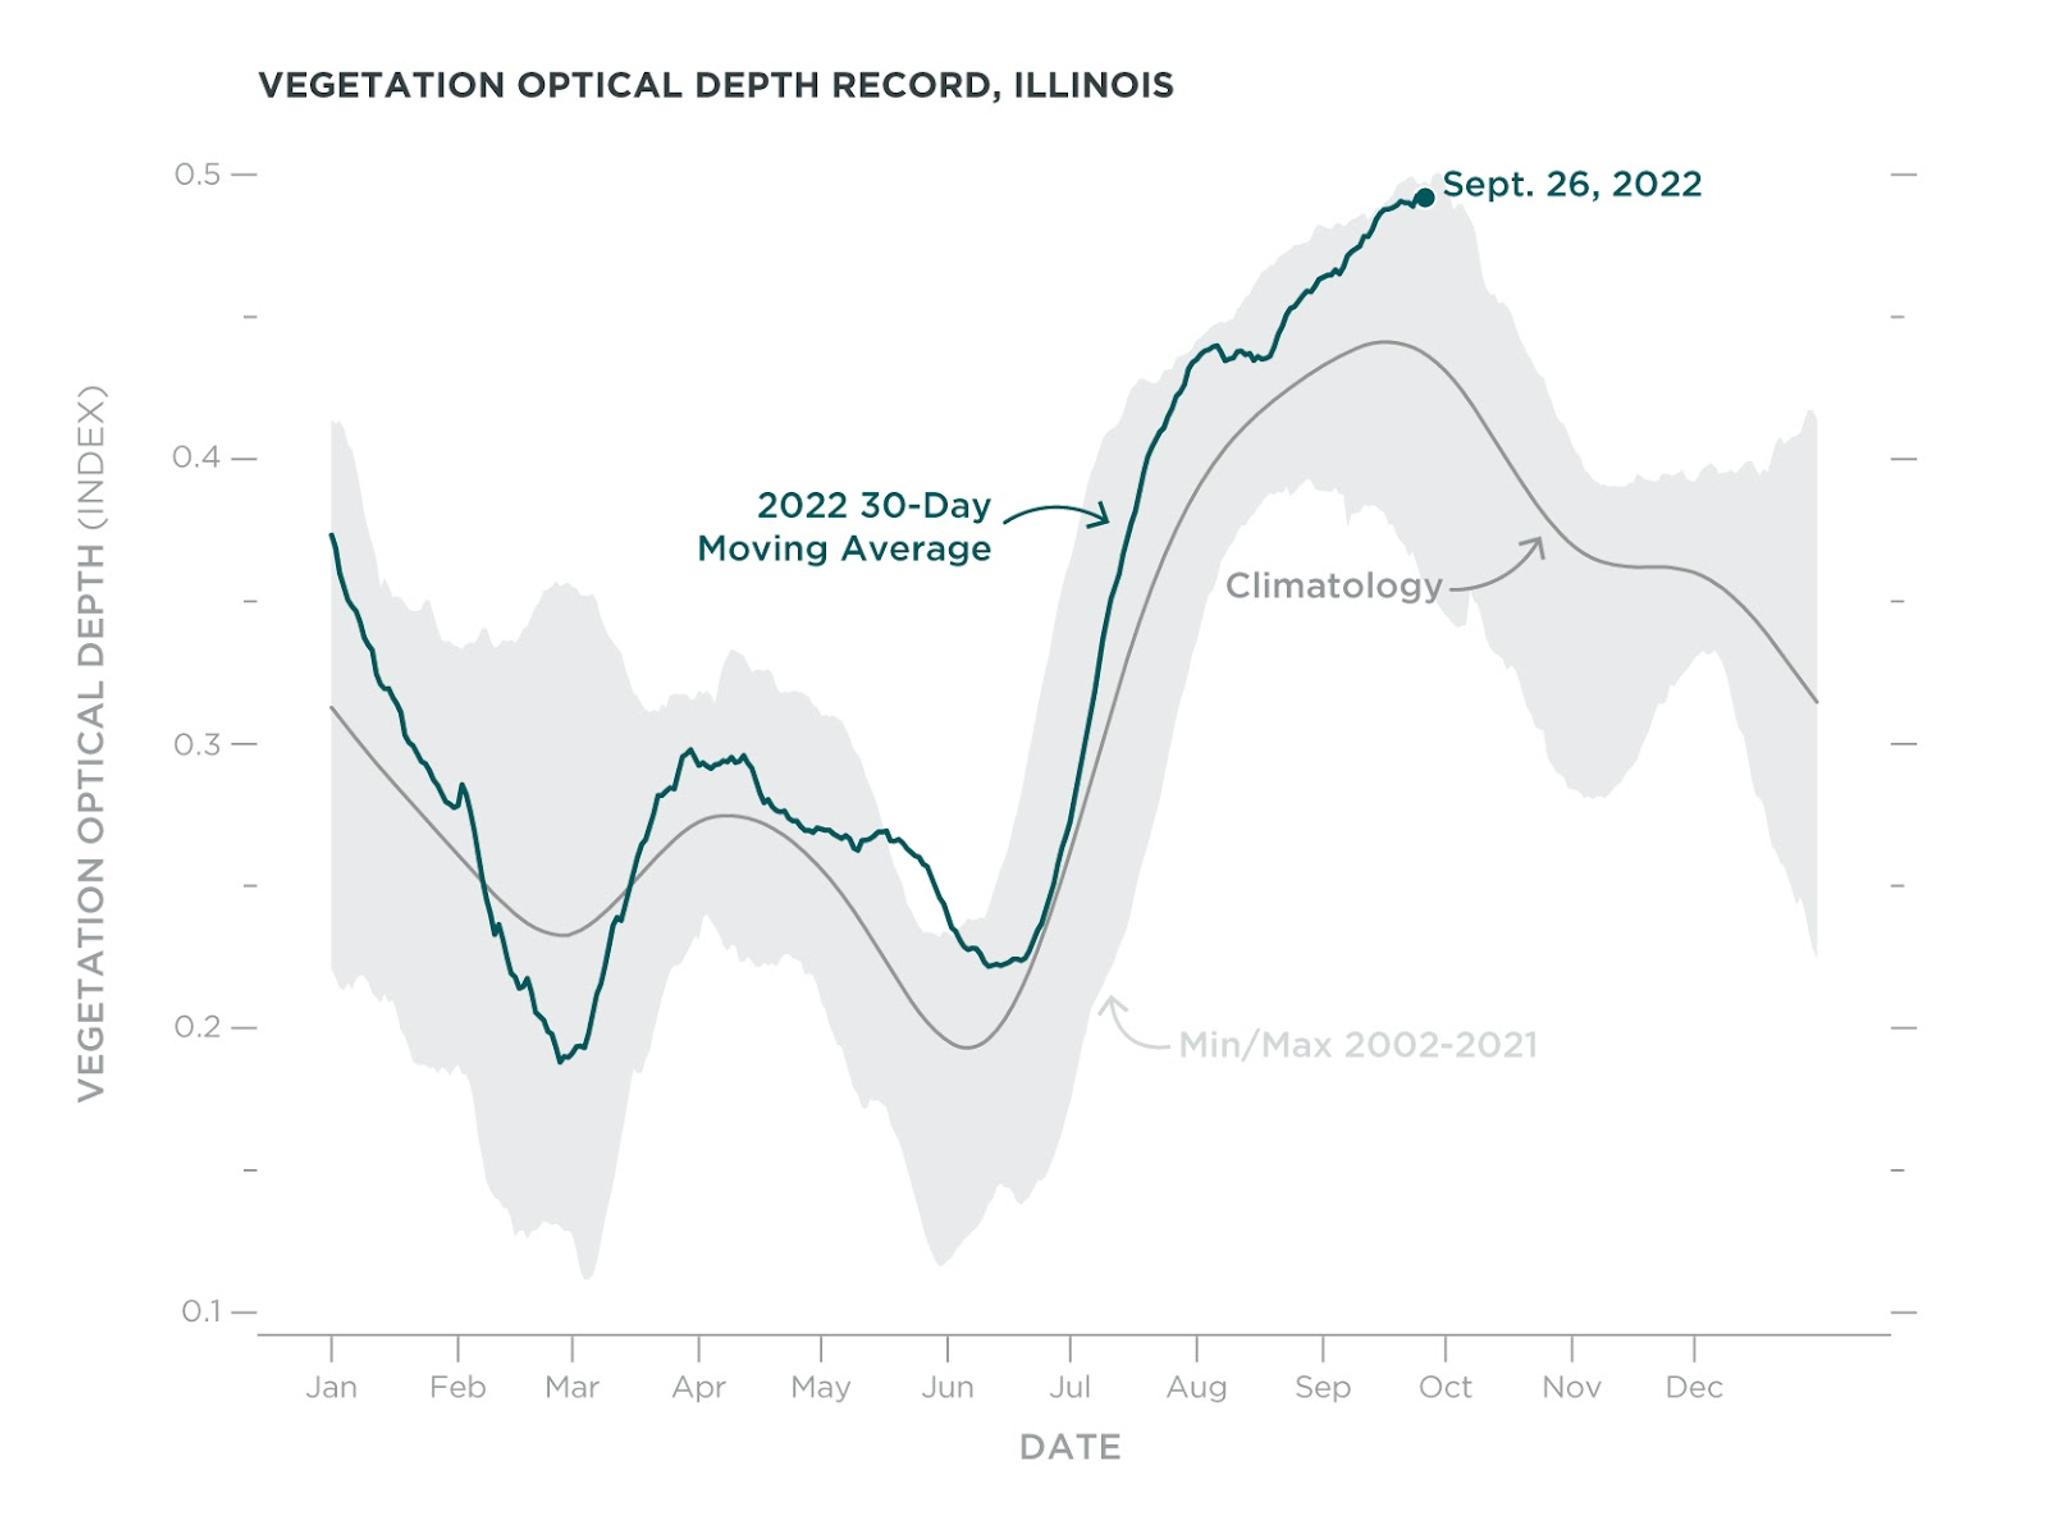
This interpretation is supported by a third Variable, the Vegetation Optical Depth (VOD). VOD is a coarse scale microwave based vegetation index that is strongly related to the vegetation water content, that is – how much water is being held in the above ground structure of the plant, like the stem and leaves. This regional signal (Fig. 2c) shows that the previously recorded delay in plant emergence might be largely offset by a strong surge in plant growth in July.
Figure 2c, Time series image of the Vegetation optical depth in Illinois, with a stronger-than-normal increase in biomass in July 2022.
Although this information is already valuable, providing unique insights into crop conditions throughout the area of interest, this does not yet give us this quantified production value for the Midwest that everyone from farmers to investors are chasing. So, how can we make sense of all of this in a quantitative way?
Why this is useful for farmers and investors
Every year’s crop yield is the result of an incredibly complex mix of factors. Genetically optimized plants grow across different local microclimates on almost 500 million acres of arable land. By capturing this multi-dimensional view of crop health in near real-time, without the interference of clouds, Planet can supply a yield forecast every day of the growing season. This is done using an algorithm that makes optimal use of Planet’s archival records, giving our statistical models an unparalleled trove of data to correlate with historical yields. The final results are based on an aggregation of over a thousand smaller models, which are out-of-sample multivariable regressions, trained daily for all individual counties in a state. This means that these models are able to find the best combinations of most impactful Planetary Variables and their defining time in the growing season. As throughout the season more information becomes available, the model will adjust accordingly and start including PV data from newly available key moments. All this combined, it sums up to a mind-blowing 2+ million model optimization runs per crop per season that lead to these daily national forecast values!
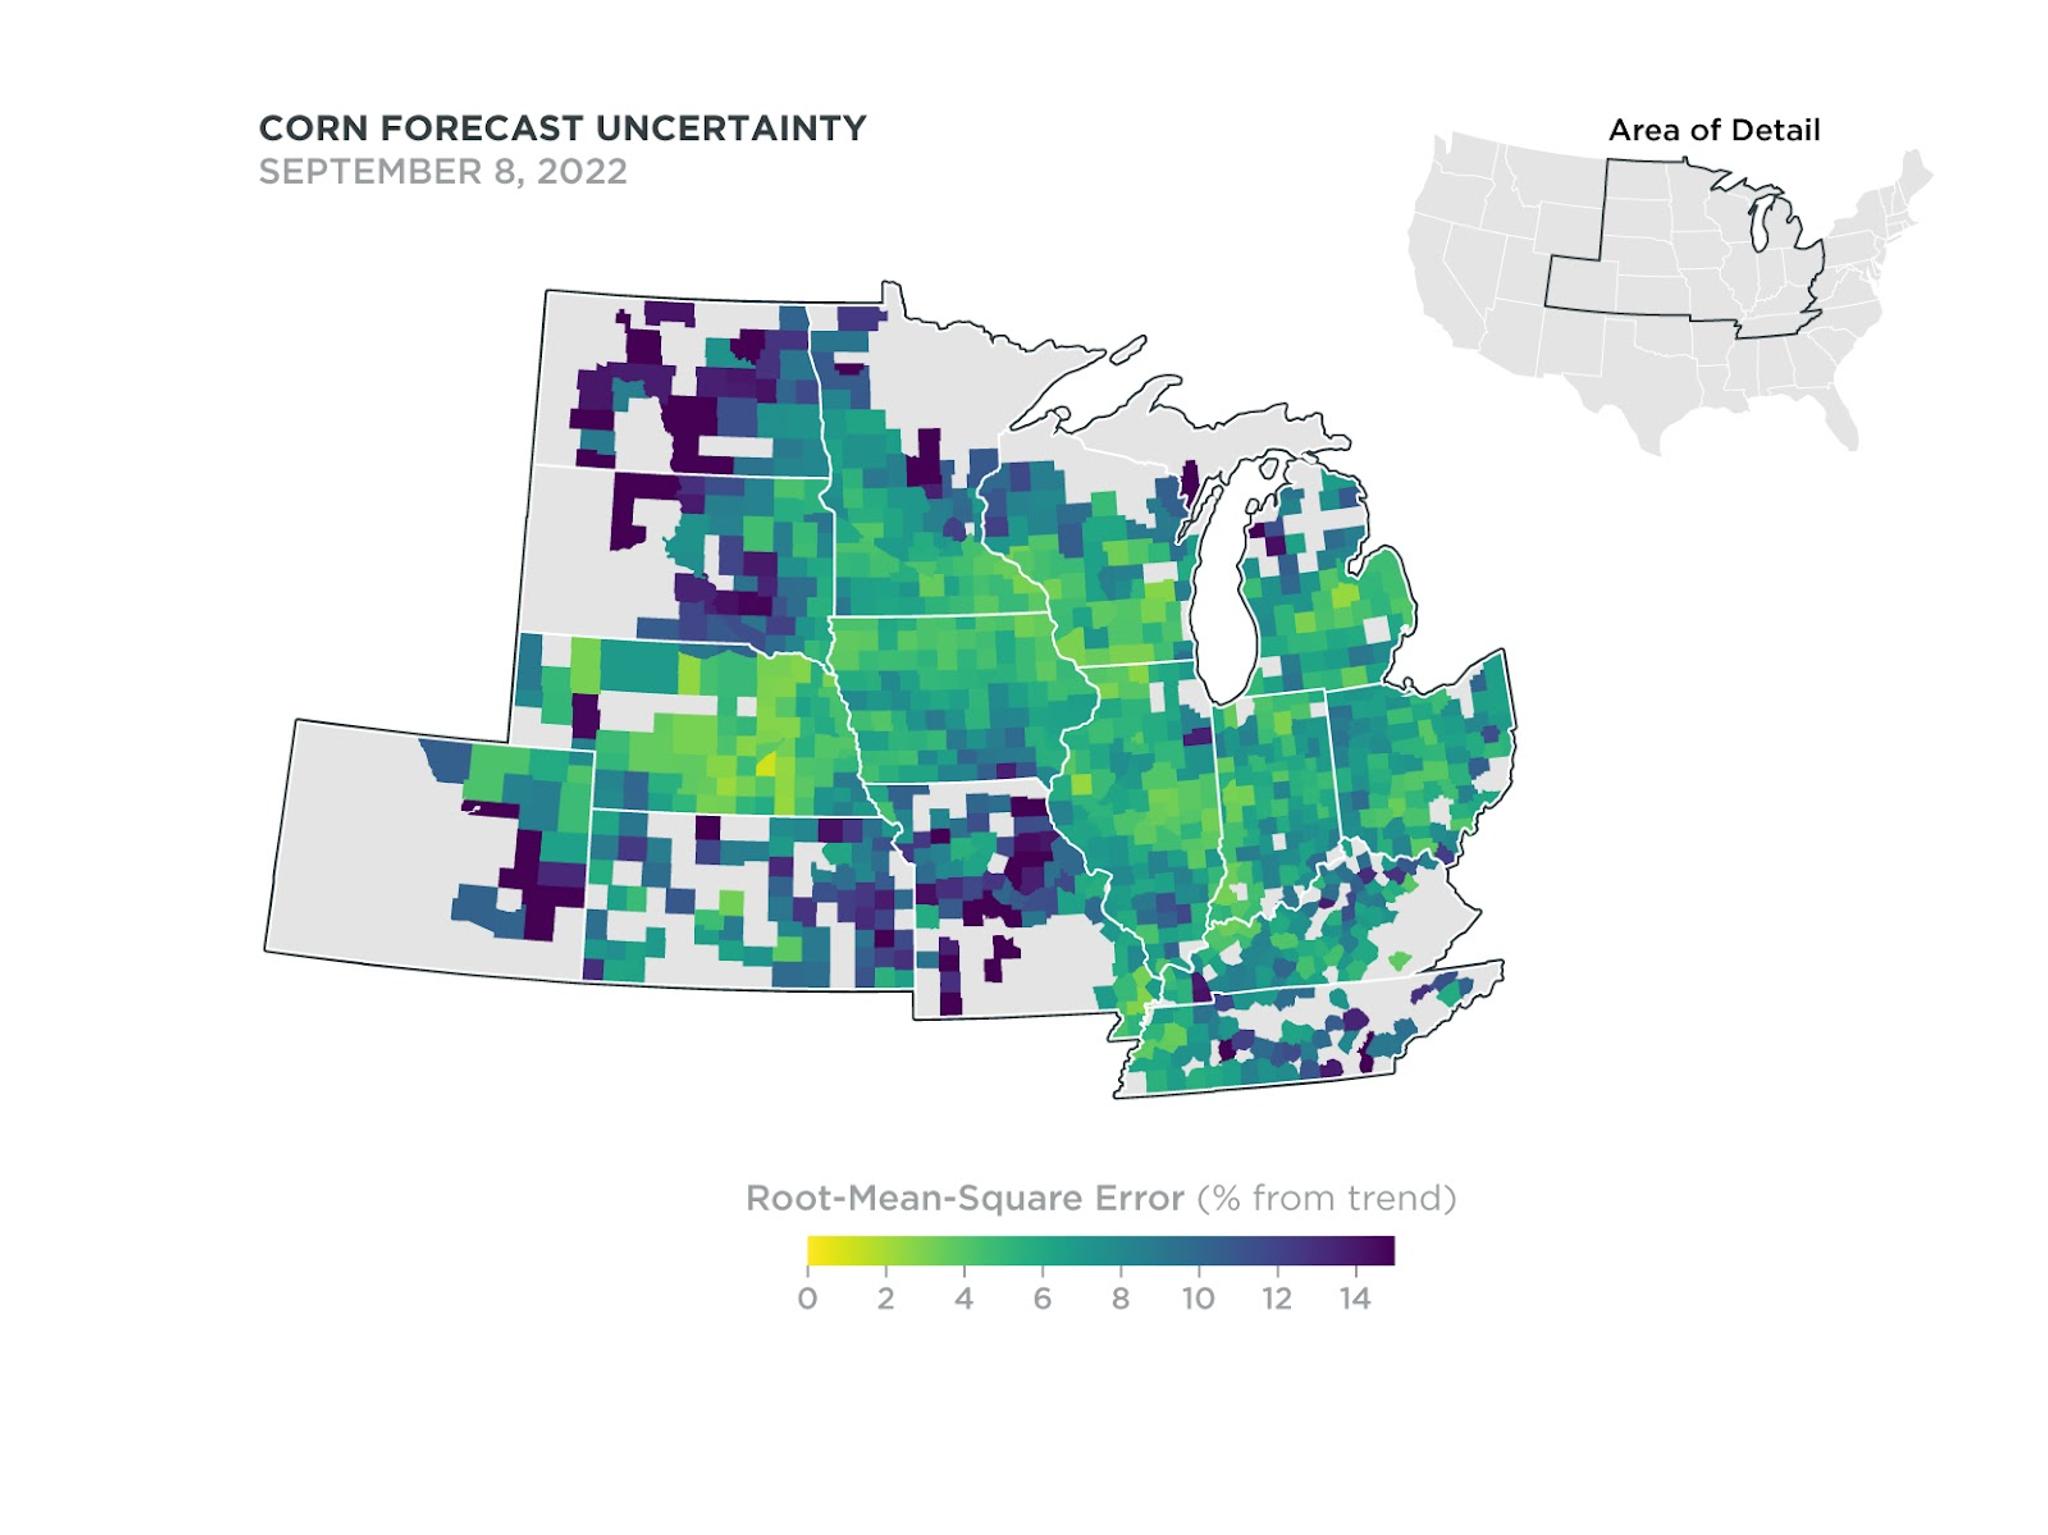
Figure 3, Spatial map of the uncertainty of the corn forecast on the 8th of September 2022, based on historical simulations of crop yield forecasts at the same day in the growing season (of which the start is based on the day that a 50% crop emergence is achieved over this state). The uncertainty value is expressed as the root-mean-square error (rmse) as a percentage of the trend yield.
As we shared at the beginning, with its variety of unusual weather patterns, 2022 has already proven to be a challenging year for crops in America’s heartland. But Planet’s Yield Forecasting solution sees some late-season improvements that increases our outlook to 177.6 bu/acre for corn and 51.1 bu/acre for soybeans compared to the USDA reports. These values are similar to those of 2021, and could provide some much needed relief for an already tense global market.
Ready to Get Started
Connect with a member of our Sales team. We'll help you find the right products and pricing for your needs.