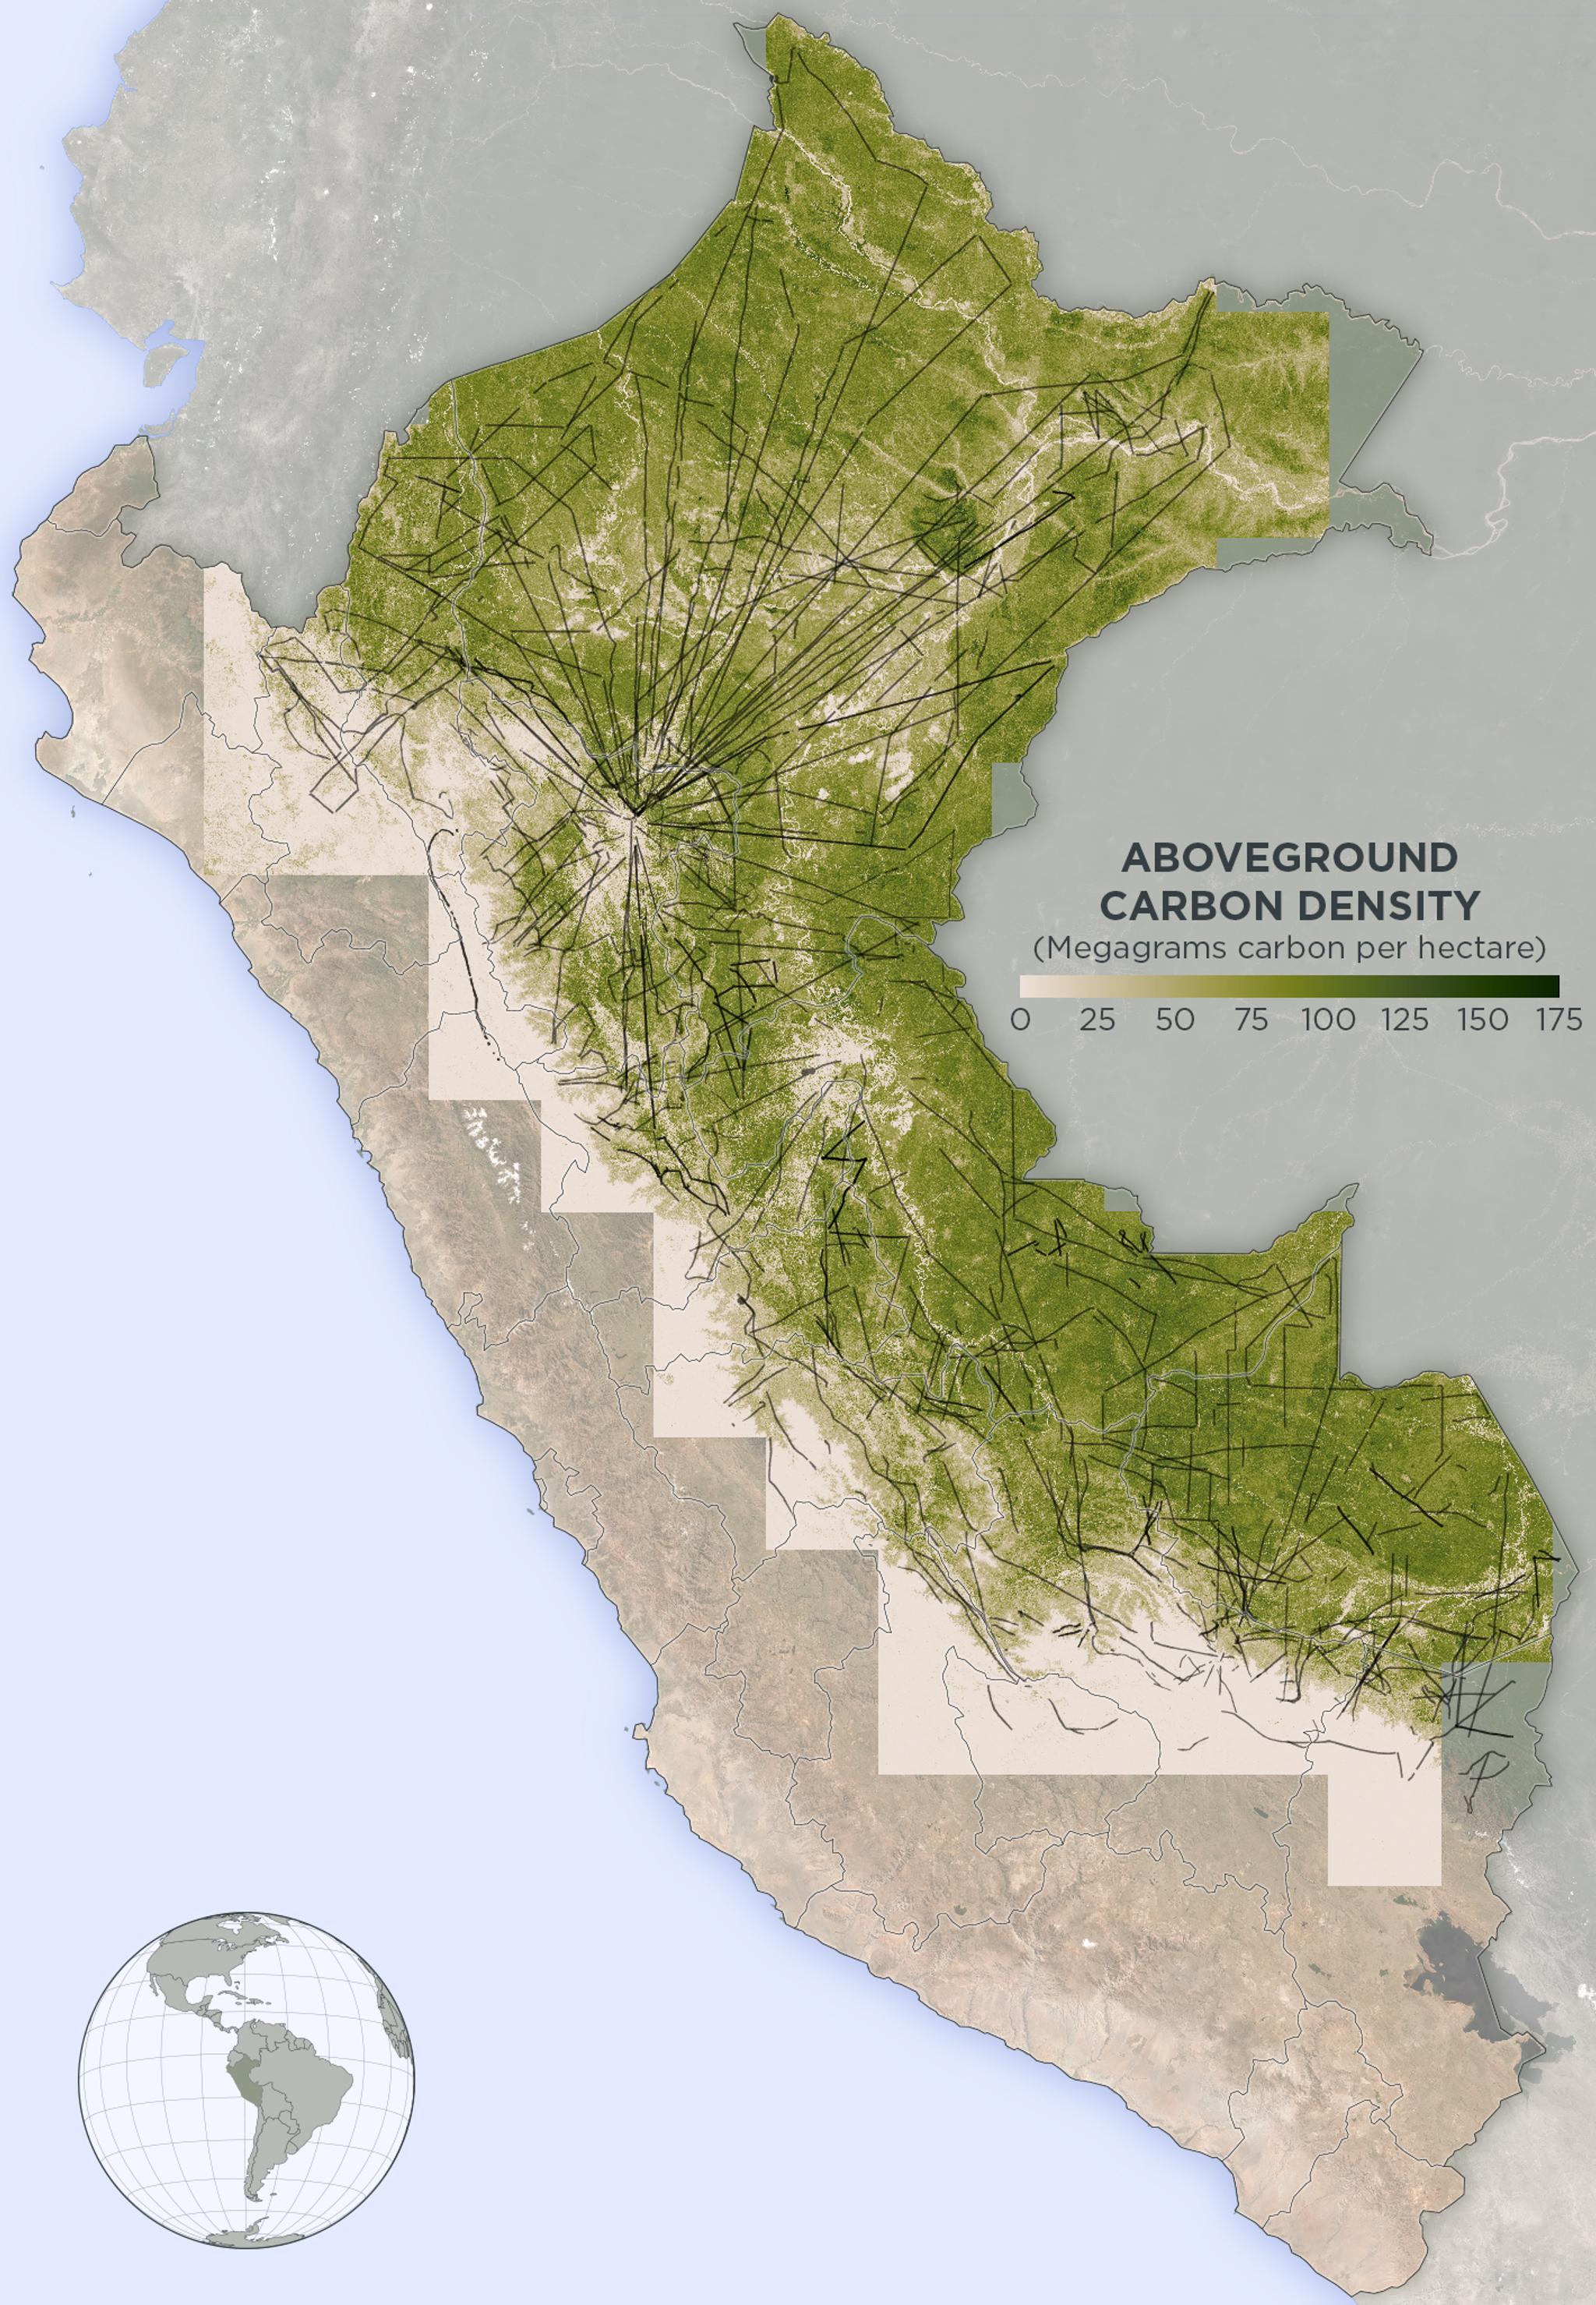
Map of above ground forest carbon in the Peruvian Amazon with LIDAR plane pathways delineated in black © 2019, Planet Labs Inc. All Rights Reserved.
AUTHOR PROFILE Tara O'Shea
Tara O’Shea is the Director of Forest Programs at Planet.

Developing the World’s First Indicator of Forest Carbon Stocks & Emissions – Update: IT’S WORKING!

News

To view these graphics at full-size, please read our Medium post.

Tropical deforestation has one common cause the world over: economic development. We learn as kids that forests take in carbon dioxide, store the carbon in plants and soils, and release the oxygen (which we conveniently need to breathe). Despite an intuitive understanding of these essential services, we have no practical way of accounting for their value in economic decisions or transactions. The result is that developing countries are incentivized to clear forests and convert the land to commodities production (palm oil, soy, mining, beef, etc.) in order to grow economically, and the world’s largest terrestrial carbon sink has now become our second largest source of anthropogenic, climate-changing carbon emissions.

If we are going to stop tropical deforestation, we have to stop the perverse economic incentives that say forests are not a valuable use of land and provide tropical countries with more sustainable pathways to economic development. We need to translate the value of forests – or the true cost of deforestation – into the global economy and find a way to measure carbon dioxide so it too can be quantified and valued, as other commodities in the open market are. Fortunately, new advances in remote sensing and machine learning technologies have the strong potential to help do just that.

In late 2018, the Erol Foundation, the Center for Global Discovery and Conservation Science at ASU, and Planet announced a breakthrough Research & Development (R&D) initiative to directly measure forest carbon stocks and emissions at high frequency across Peru. Now at roughly the project’s halfway point, we wanted to provide an update on this effort to develop the world’s first Forest Carbon Indicator. In short: it’s working!

Over the past 10+ years, the UNFCCC has forged real leadership on this issue. Under Articles 5 & 6 of the 2015 Paris Agreement, developing tropical countries can Measure, Report, and Verify Reduced Emissions from Deforestation and Forest Degradation (REDD+) in exchange for performance-based payments. The problem? It’s extremely tough to measure REDD+, and this presents a challenge for both delivering on the public performance-based payments and for translating the value of forests’ climate services beyond development finance and into private finance.

Technological limitations have required a two-step process to measuring REDD+: 1) Using traditional satellite imagery to estimate forest area change over a 1-2 year time period, and 2) Multiplying that change by an estimated carbon stock, based on tree size and species. Essentially, we are technologically limited to multiplying one estimate by another at national scales.

In the past few years, it has also become possible to use airborne Light Detection and Ranging (LiDAR) sensors to directly measure forest carbon. Due to how expensive it is to fly this sensor at scale, however, this can really only be done at one point in time and/or at small scales. (Black lines on the map to the right show LIDAR flight paths mapping canopy height in the Peruvian Amazon)

But, what if parallel advances in remote sensing and machine learning could make it possible to derive the same insights from less expensive, more frequent sensors? Might it be possible to finally have the practical tools we need to value the critical climate services that forests are providing, in both public and private finance flows? That is exactly what this project sets out to explore.

With the support of the Erol Foundation, the Center for Global Discovery and Conservation Science (GDCS) at ASU and Planet hired two post-doctoral researchers to develop and publish computer vision models that correlate the volumetric qualities of the GDCS airborne LiDAR data to the spatial structure of PlanetScope data over Peru. The project also utilizes the frequent tasking of Planet’s high-resolution SkySat satellites over key areas of the Peruvian Amazon to calibrate and validate the models’ spatial texture and volumetric analyses. 

With these models in place, Planet’s daily 3-5 meter resolution satellite imagery can feed them every day from space. The result is the ability to automatically and cost-effectively directly measure and map forest carbon stocks and emissions at high resolution and high frequency. The findings of the project to date indicate these results are robust at both national and local levels. 

The Center for Global Discovery and Conservation Science (GDCS) at ASU’s new aboveground carbon density map reveals fine structure of the biomass stored in tropical forests. This allows accurate measurement of the carbon lost during deforestation, such as the construction of this cacao plantation near Tamshiyacu, Peru (left). The detail is the result of combining airborne LIDAR data with 3–5 meter resolution PlanetScope data (right).

The project uses machine learning to correlate the spatial characteristics of PlanetScope and SkySat data with the volumetric characteristics of LiDAR data, producing a frequent and spatially-explicit indicator of forest carbon stocks and emissions across the country of Peru.

Testing the model’s ability to measure changes in forest carbon stocks and emissions over time, researchers pushed two monthly PlanetScope mosaics in a region of high degradation through the computer vision model. The output was an automatic detection and measurement of where forest carbon changed, capturing more than 110 Mg C / ha of previously unaccounted for emissions from degradation over the one-month time period.

The implications of these preliminary results cannot be understated. The combination of improved remote sensing and advanced analytics enables the ability to directly measure and map forest carbon, in a spatially-explicit and accurate way, at a national scale, over (frequent) time.  

This R&D project is a game changer, and with NASA’s recent launch of the GEDI mission, it could scale globally. Special thanks to our partners at the Erol Foundation, the ASU Center for Global Discovery and Conservation Science, and the Ministry of Environment (MINAM) in Peru. We’ll be posting updates frequently, follow along @planetlabs.