
Flash Drought Hotspots: Southwestern United States
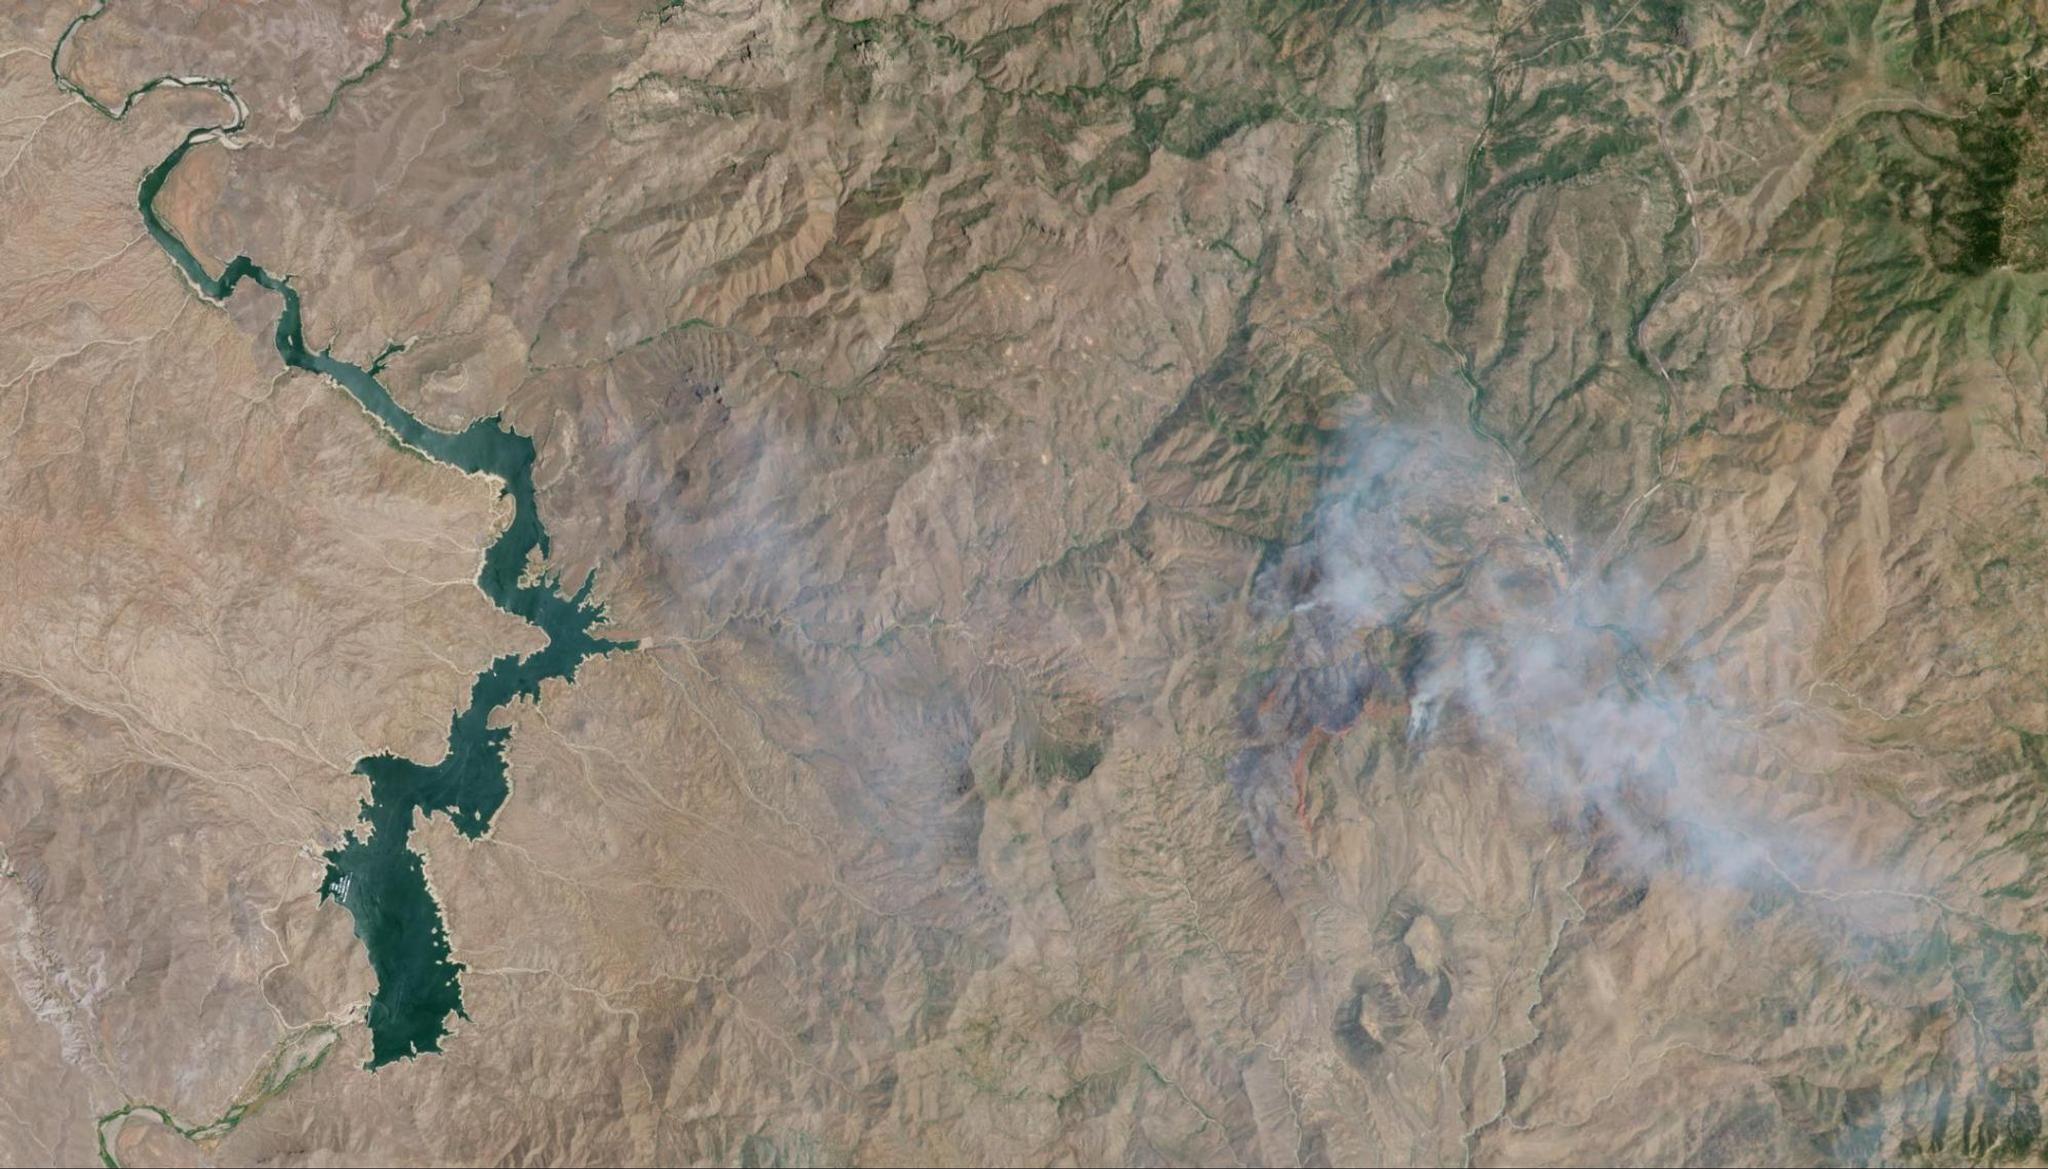
PlanetScope image of the Diamond Fire in Maricopa County, Arizona, USA taken July 26, 2023. © 2023, Planet Labs PBC. All Rights Reserved.
StoriesAuthors: Ryder Kimball & Steve Levay
Special thanks to: Max Borrmann, Arjan Geers, and Megan Zaroda
This blog is part of a series on the effects of rapid dryness on regions around the globe. For an introduction to Planet’s approach, read this post.
For those of us in the U.S., the very word “Southwest” tends to evoke images of dryness: deserts reaching to the horizon, blinding sunshine, and tumbleweeds—even saying it leaves your mouth a little parched. Yet despite its arid harshness, life there has taken root between the mirages and mesas. It’s an existence specifically adapted to water scarcity, with all the spikes, scales, and brittleness to prove it.
To call this swath of North America home is to accommodate water’s ebbs and flows; to live with one eye on reservoir levels and the other scanning the horizon for clouds. But climate change is placing new pressures on this system. The region’s desert ecosystems may be elastic—able to bend with given changes—but what was once gradual is now becoming more steep and severe. The stresses are mounting, and the way of life for millions of people living the Southwest is threatening to snap.
Since the turn of the century, the Southwest has been in a megadrought as it experiences its driest conditions in the past 1,200 years. Studies show that 42% of the soil moisture deficit during this period can be attributed to climate change. And the outlook offers little reassurance. This July, daytime Land Surface Temperature (LST) measurements have consistently exceeded previous record highs in the last 7 years for the Southwest US and parts of Mexico, repeatedly passing 50°C (122°F).
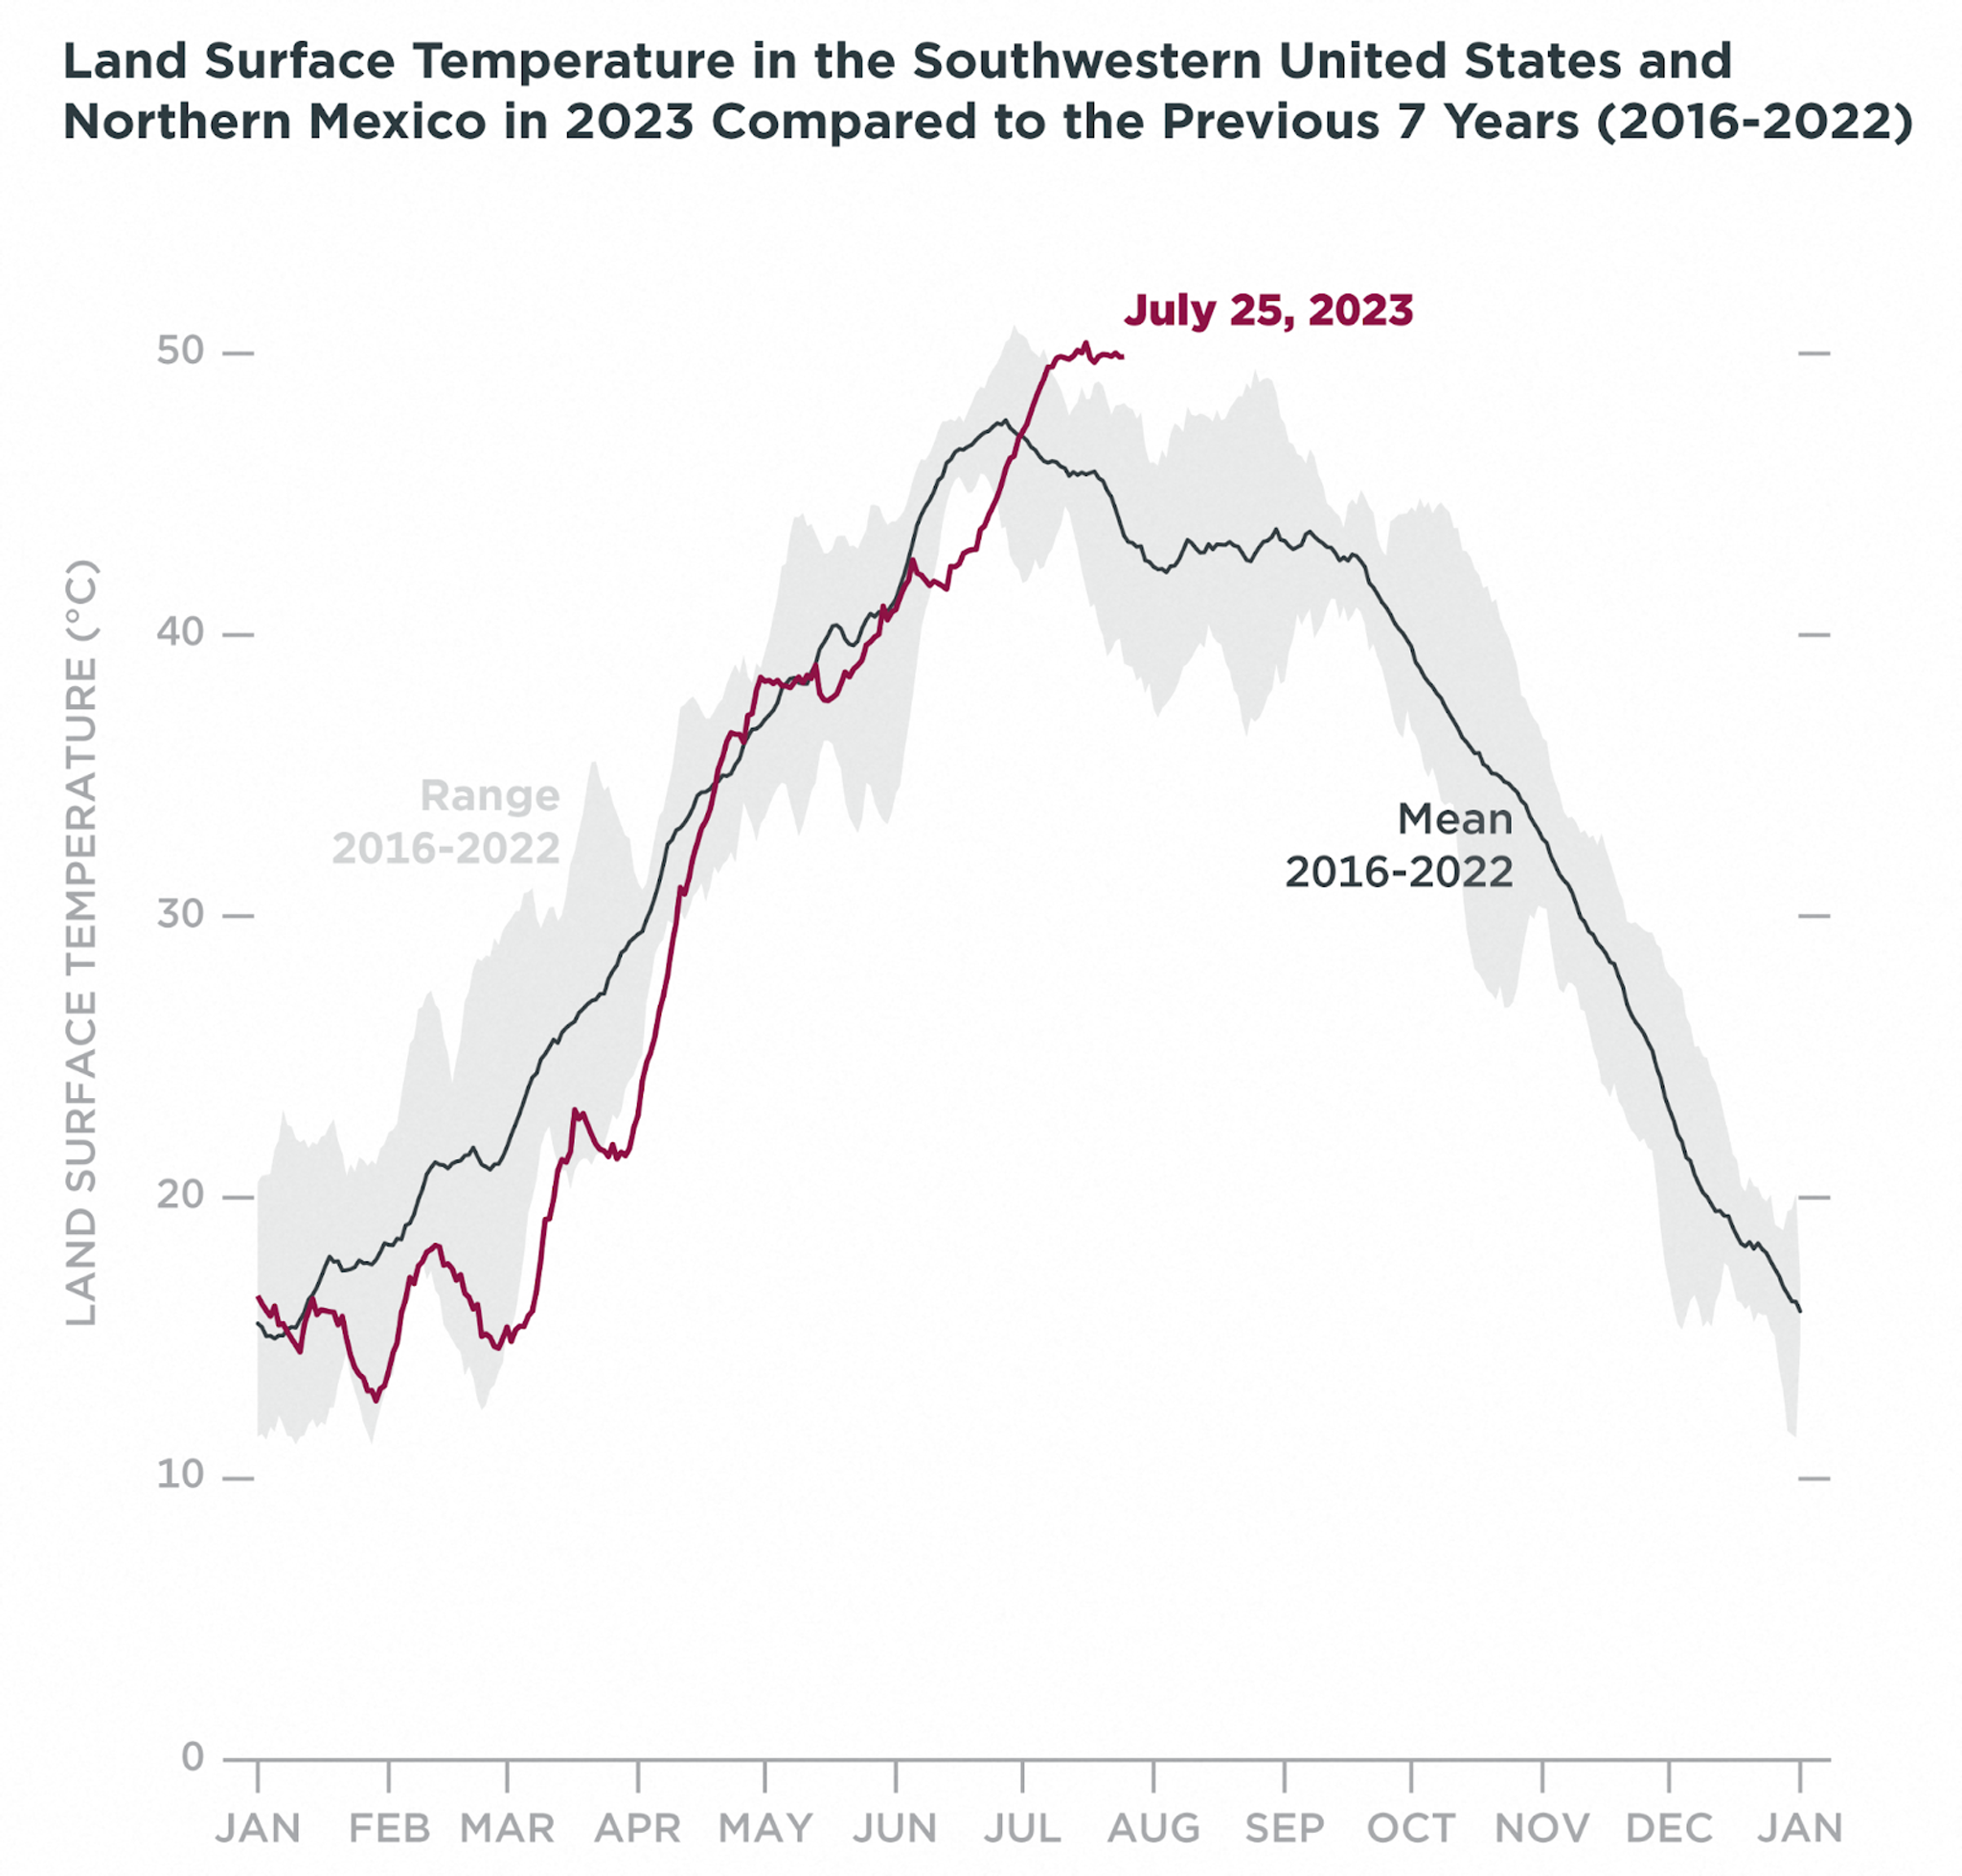
Land Surface Temperature (LST) from 2023 over an area of the Southwest United States and parts of Northern Mexico where Planet’s Soil Water Content data showed notable dryness earlier in the year (see map of area below). A rolling average from the previous 14 days is shown in magenta. The black line represents the average measurement for that particular day of the year throughout the previous 7 years (2016-2022) and the gray area captures the range of measurements throughout the time period.
The equation is pretty simple: as temperatures rise, evaporation increases and water resources dwindle. What’s more complicated is modeling precisely where that dryness occurs and how it affects the people and industries reliant on a steady supply. Drinking water, agriculture, wildfire sensitivity, hydropower production, and aquatic recreation are all under threat.
In the Southwest, as is elsewhere, it begins and ends with water. Since the 1950s, flash droughts—dry conditions occurring rapidly (often within weeks)—are becoming more common than the typical slow-moving ones, new research shows. They’re harder to monitor and difficult to forecast, but planetary forensics can help identify and analyze particularly drought-prone regions.
Planet’s Soil Water Content (SWC) dataset captures the conditions that signal drought using granular, real-time measurements. A team at Planet developed a methodology that highlights areas that reach a certain threshold for dryness and changes in soil moisture. These “hotspots” are warning indicators of potential flash droughts, and by counting the number of days any given area saw hotspot conditions, those regions can bring to light the severity of dryness across time. Apply this to the entire planet and a dashboard of at-risk regions emerges.
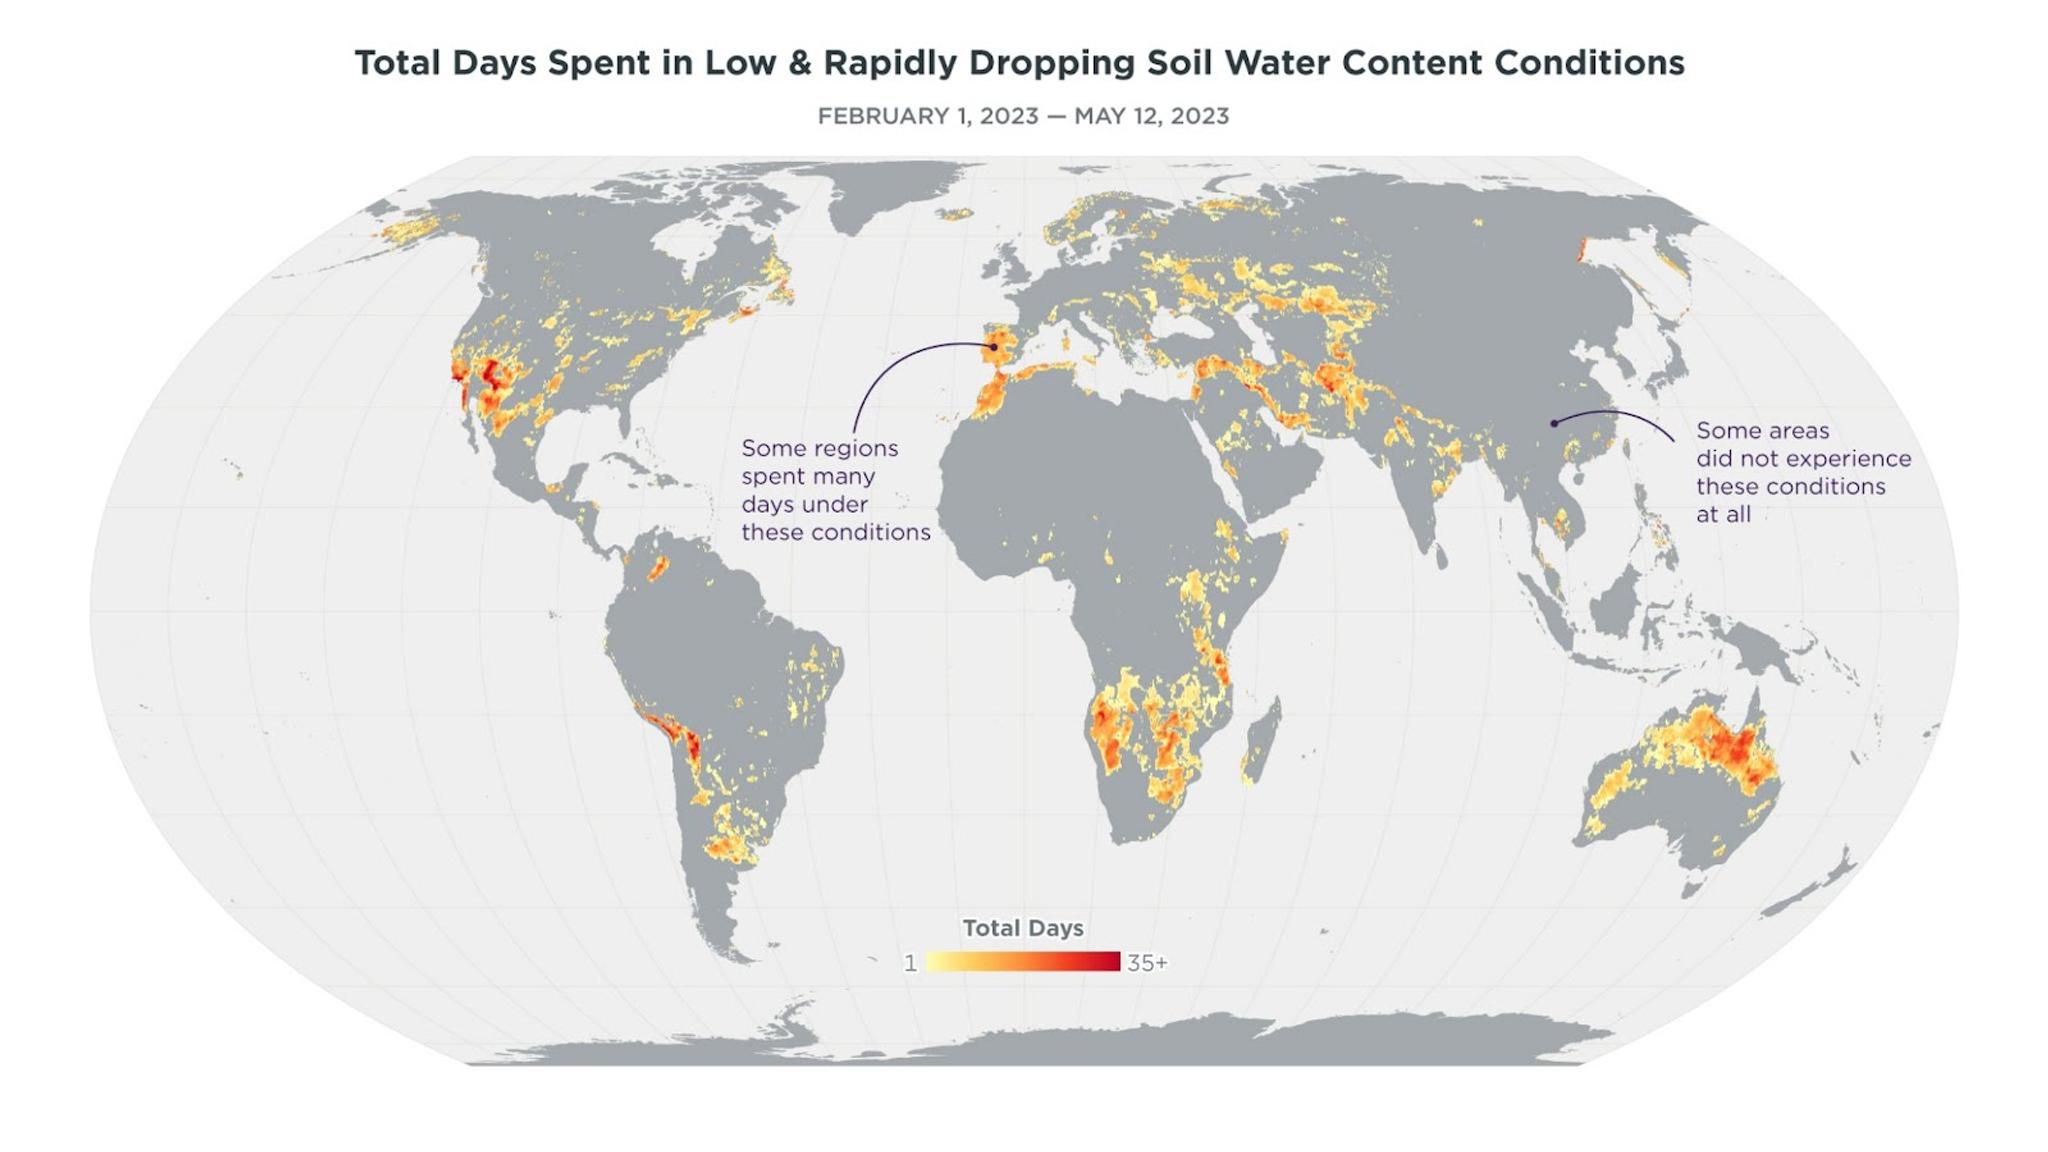
Isolating flash drought risk hotspots by measuring the number of days a region experienced the rapid change conditions. This map designates each pixel with a color based on the number of days it showed low and decreasing conditions from February 1 to May 12, 2023. In this visualization, 1 = 1 day, 30 = 30 days during that period. Areas that are darker red were in hotspot status more frequently.
In the Southwest US and parts of Mexico, the closer look is worrisome. The year had a promising start, with the arrival of an El Niño cycle that brought some rainfall relief. Certain regions in the area, like Arizona, received considerable rain after a late winter storm arrived in early March. But, towards the end of the month and through April, SWC dropped sharply, coinciding with a rise in LST. A small bump in SWC in the early summer fell to low levels shortly after.
The most important meteorological event for the region, however, just kicked off. The North American Monsoon occurs each summer as moist air from the Pacific Ocean and the Gulf of California circulates over the Southwest US and Northern Mexico. This year’s El Niño has delayed the start, and forecasts suggest a weaker monsoon for 2023. July and August are often the rainiest months of the year, and despite the recent increase in SWC data from the monsoon, it remains concerningly below average.
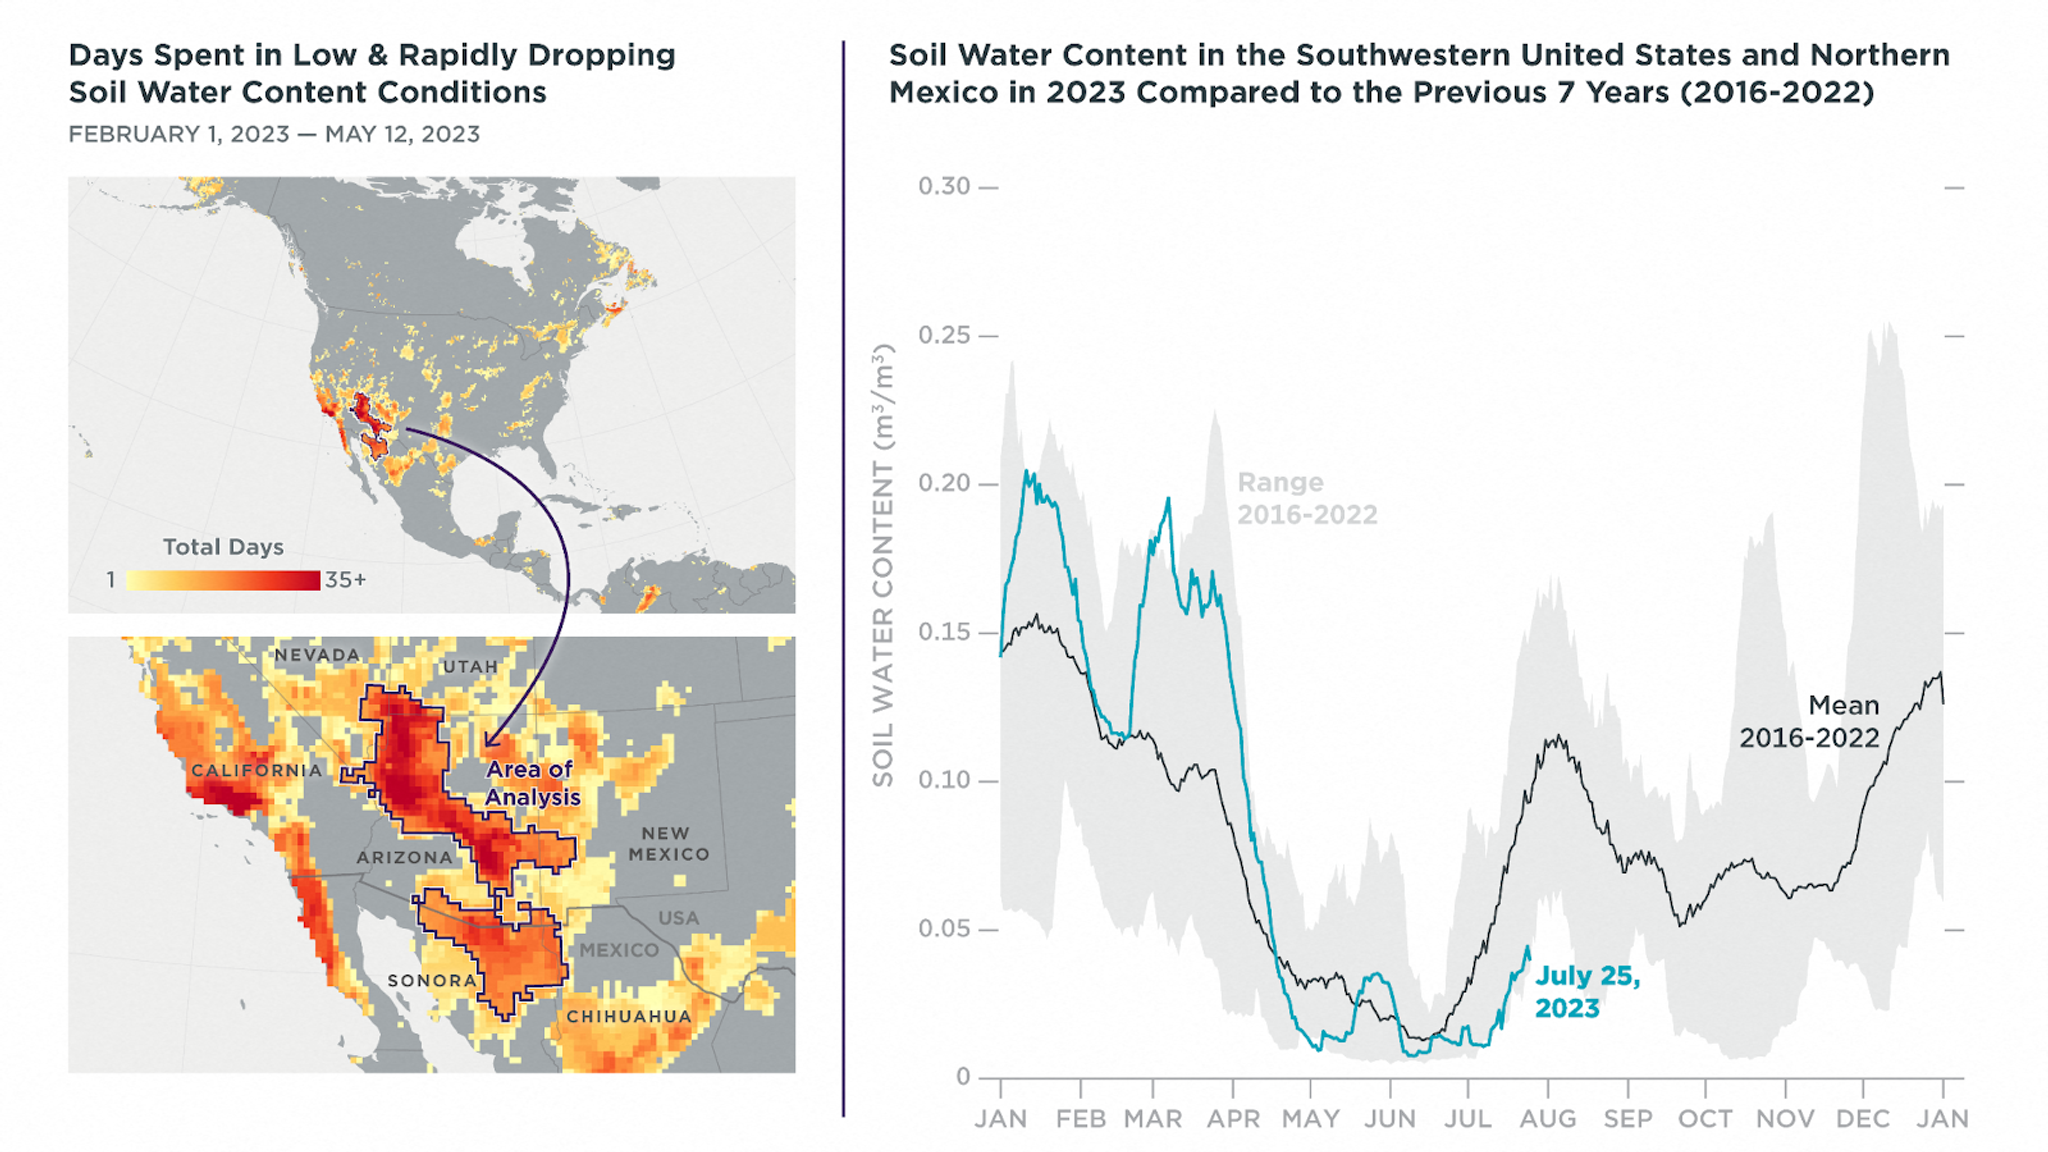
Soil Water Content (SWC) from 2023 over an area of the Southwest US and parts of Northern Mexico where an analysis of Planet’s data (see maps) showed notable dryness earlier in the year. A rolling average from the previous 14 days is shown in teal. The black line represents the average measurement for that particular day of the year throughout the previous 7 years (2016-2022) and the gray area captures the range of measurements throughout the time period.
Water is the limiting factor for industries in the Southwest. Shrinking reservoirs and rivers have put water managers in the uncomfortable position of jockeying supply between drinking water, agriculture, and hydropower production. Tracking rapid drought changes at this scale and tempo can help them decide the optimal proactive measures. And this tool is especially effective for monitoring wildfires.
Take a bone-dry landscape, layer an extensive electric and residential network over this kindling, add aggressive winds, and all it takes is a spark or a lightning strike to ignite untold destruction. Wildfires are inherently unpredictable, but the conditions that lead to their existence are not. The earlier you can intervene in the process the better. And SWC data is a powerful way to predict how much moisture is present in fuel loads. The lower the moisture content, the easier the ignition. The ability to map and monitor these critical areas can be incorporated into danger rating systems and give managers a better sense of susceptible areas before they catch fire.
Current weather forecasts and underlying conditions like soil moisture led the National Significant Wildland Fire Potential Outlook to forecast above normal fire risk conditions for much of Arizona and parts of Southern Nevada and Utah. With luck, monsoon rains will finally arrive and reduce the wildfire potential through the rest of the summer, but the rapid drying earlier in the year has contributed to precarious conditions.
Zoom back out to the global raster and it’s clear that the Southwestern part of North America is not alone in their risk profile. We’ll be taking a closer look at other hotspot regions that have recently experienced rapid drying in the coming weeks and how they compare to historical data.
Companies across many sectors put satellite datasets like Planet’s Soil Water Content to use in solving real problems. Insurers against drought, for example, need objective measurements that can assess impacts to crops, especially as climate change accelerates risks. In partnership with AgroInsurance International, we recently conducted a survey of nearly 90 insurers, brokers, reinsurers, and service providers to understand new trends in their sector and to understand how they work with remote sensing data. Download our white paper on the survey results to learn more.
Ready to Get Started
Connect with a member of our Sales team. We'll help you find the right products and pricing for your needs.