
Forest Carbon Diligence: Breaking Down the Validation and Intercomparison Report
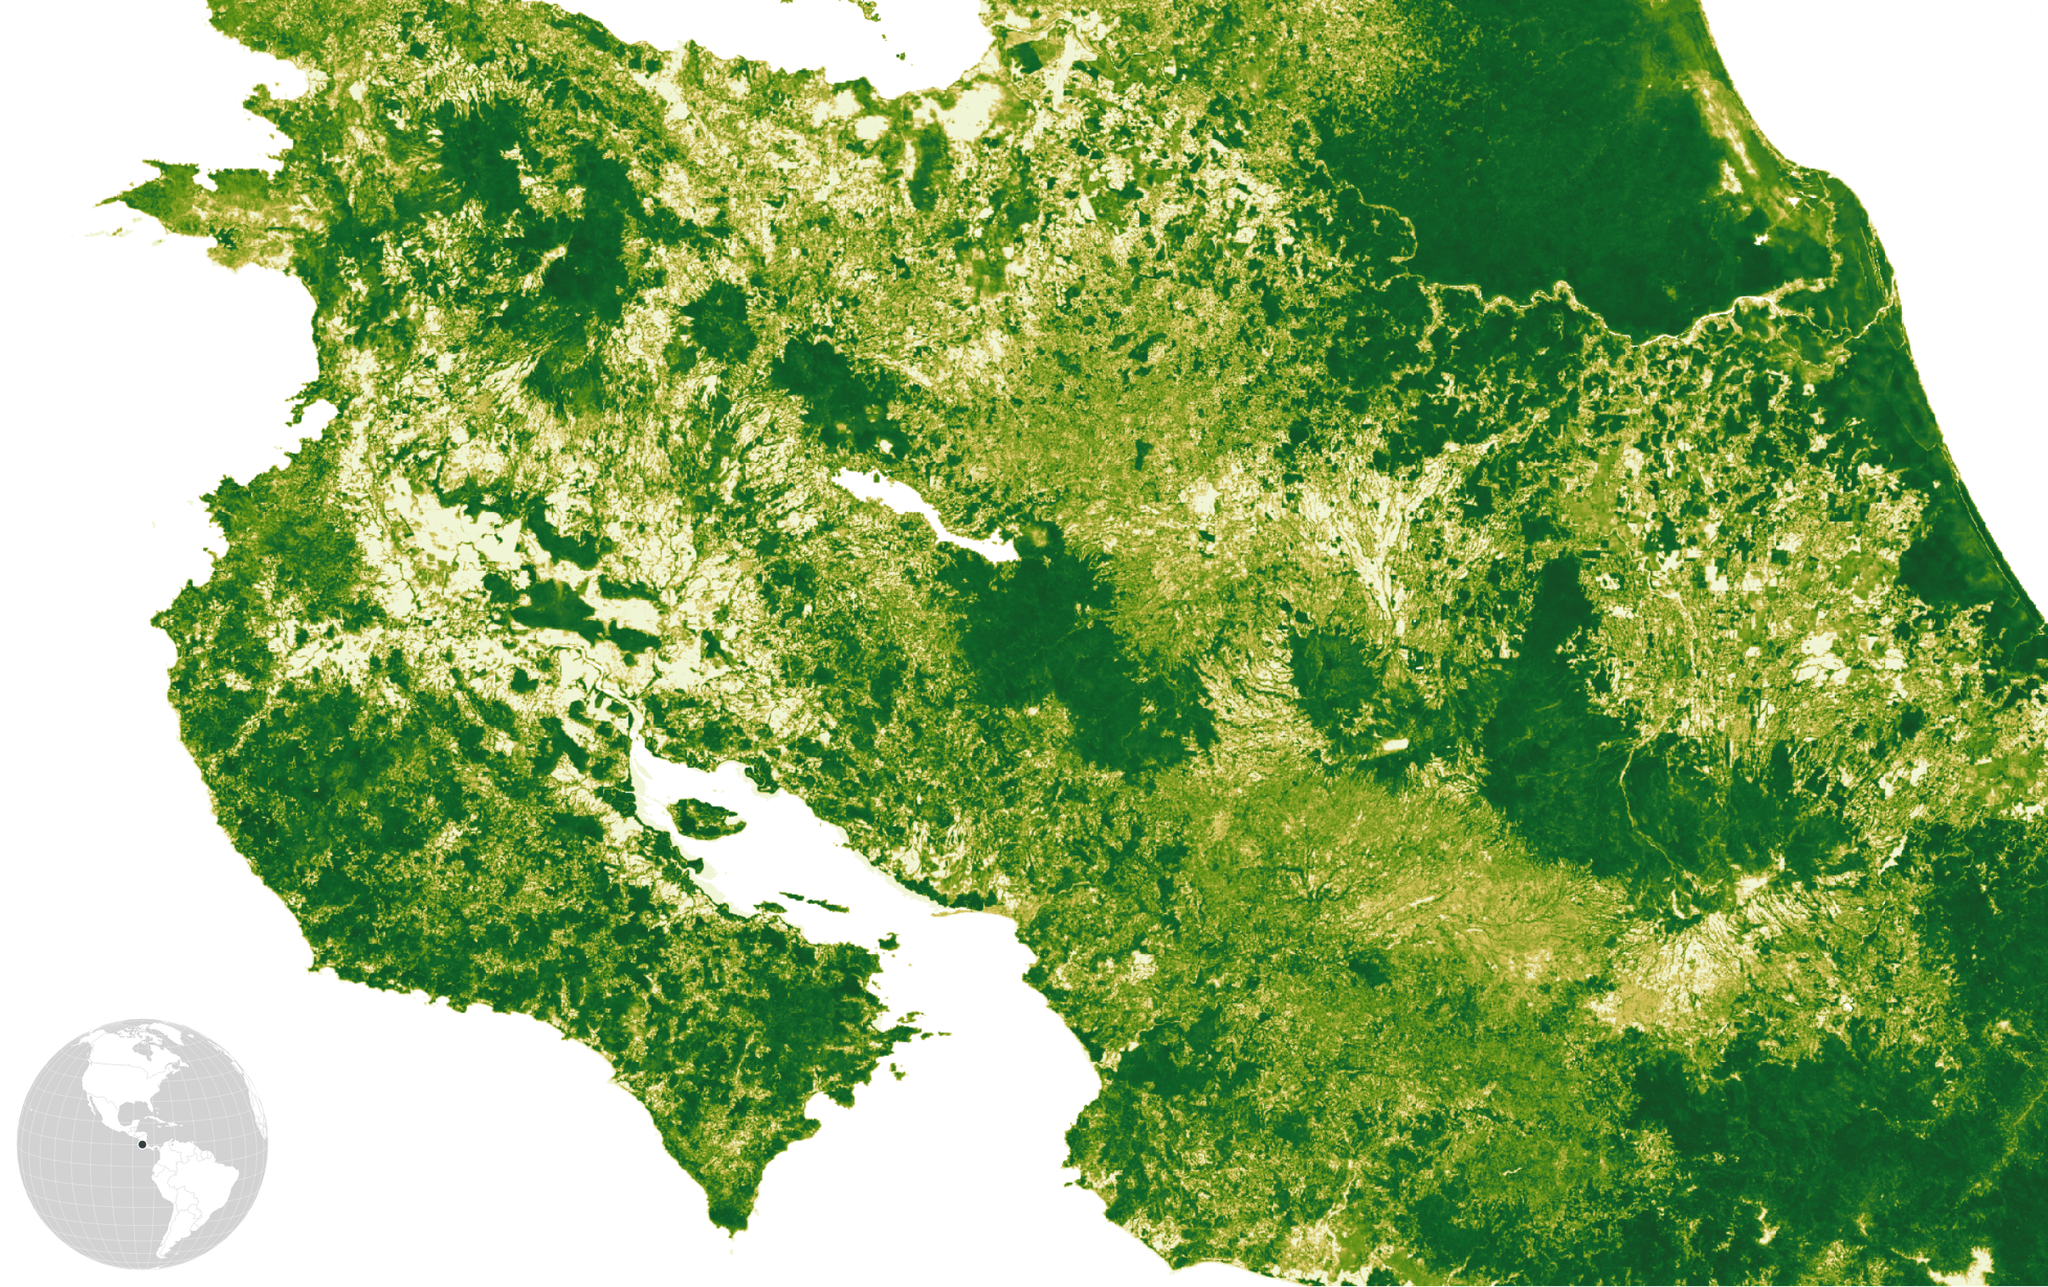
Canopy cover in the Nicoya Peninsula and on the border between Costa Rica and Nicaragua shows the extent of dramatic gains in tree cover, following a peak of deforestation in the 1970’s and 1980’s.
TechMapping trees from space is a technically challenging endeavor. It may seem straightforward at times — what’s so hard about counting all those round green things in satellite images? It may also seem like a solved problem, since the foundations of forest monitoring were established in the 1980s. But like the history of most technologies, the story of mapping forests from space is the story of uncovering layer after layer of complexity in the patterns we find.
Major technological breakthroughs are often paired with competing discoveries that challenge or invert the paradigms that lead to the initial breakthrough. The publication of the Global Forest Change dataset revolutionized forest monitoring at the time, revealing 2.3 million km2 of tree cover loss over the first decade of the 21st century using high resolution imagery. But that wasn’t the whole picture. A couple of years later, researchers from the same team zoomed out, analyzing trends over three decades, finding that global tree cover has actually increased globally by 2.24 million km2 since 1982 (+7.1% relative to baseline). Each new advance in this domain is bound to include some additional caveat, some amount of uncertainty, and us scientists are constantly refining our methods to improve signal quality and reduce noise when measuring how the world’s forests are changing.
Today we want to share more about the technological advances we’ve made at Planet in building the Forest Carbon Diligence products, as well as the caveats and uncertainties that accompany these products. The suite of Diligence products includes a 10-year historical time series with estimates for aboveground carbon density, canopy height, and canopy cover provided globally at 30 meter nominal resolution. You can think of Diligence as a multi-year, GEDI-like forest carbon data product with wall-to-wall spatial coverage. It is worth distinguishing Diligence, an historical archive product built using public satellite data sources, from our Forest Carbon Monitoring product. Monitoring is built on PlanetScope, provides quarterly updates, and is coming soon. The Diligence product established a baseline of quality upon which we are building the Monitoring products, and we’ll discuss this baseline below.
Planet recently released the Diligence Validation and Intercomparison Report, which includes comparisons with 8 independent forest biomass datasets around the globe, including NASA and ESA data, national forest inventories, field plots, and airborne LiDAR. It’s the companion to the Diligence Technical Specification, which describes our model training methods and training data performance. These numbers reflect model performance using Version 1.1 of the Diligence data, which was just released. There’s a lot of material in these documents, so we’re breaking down what we believe are the most important things you might want to know.
We’ll address the following questions in this post:
- What’s in the report?
- What are the key takeaways?
- How were the models trained?
- What are some of the biggest current challenges?
- How does Diligence compare to other emerging commercial products?
- What’s next for the Forest Ecosystems team?
Let’s get started.
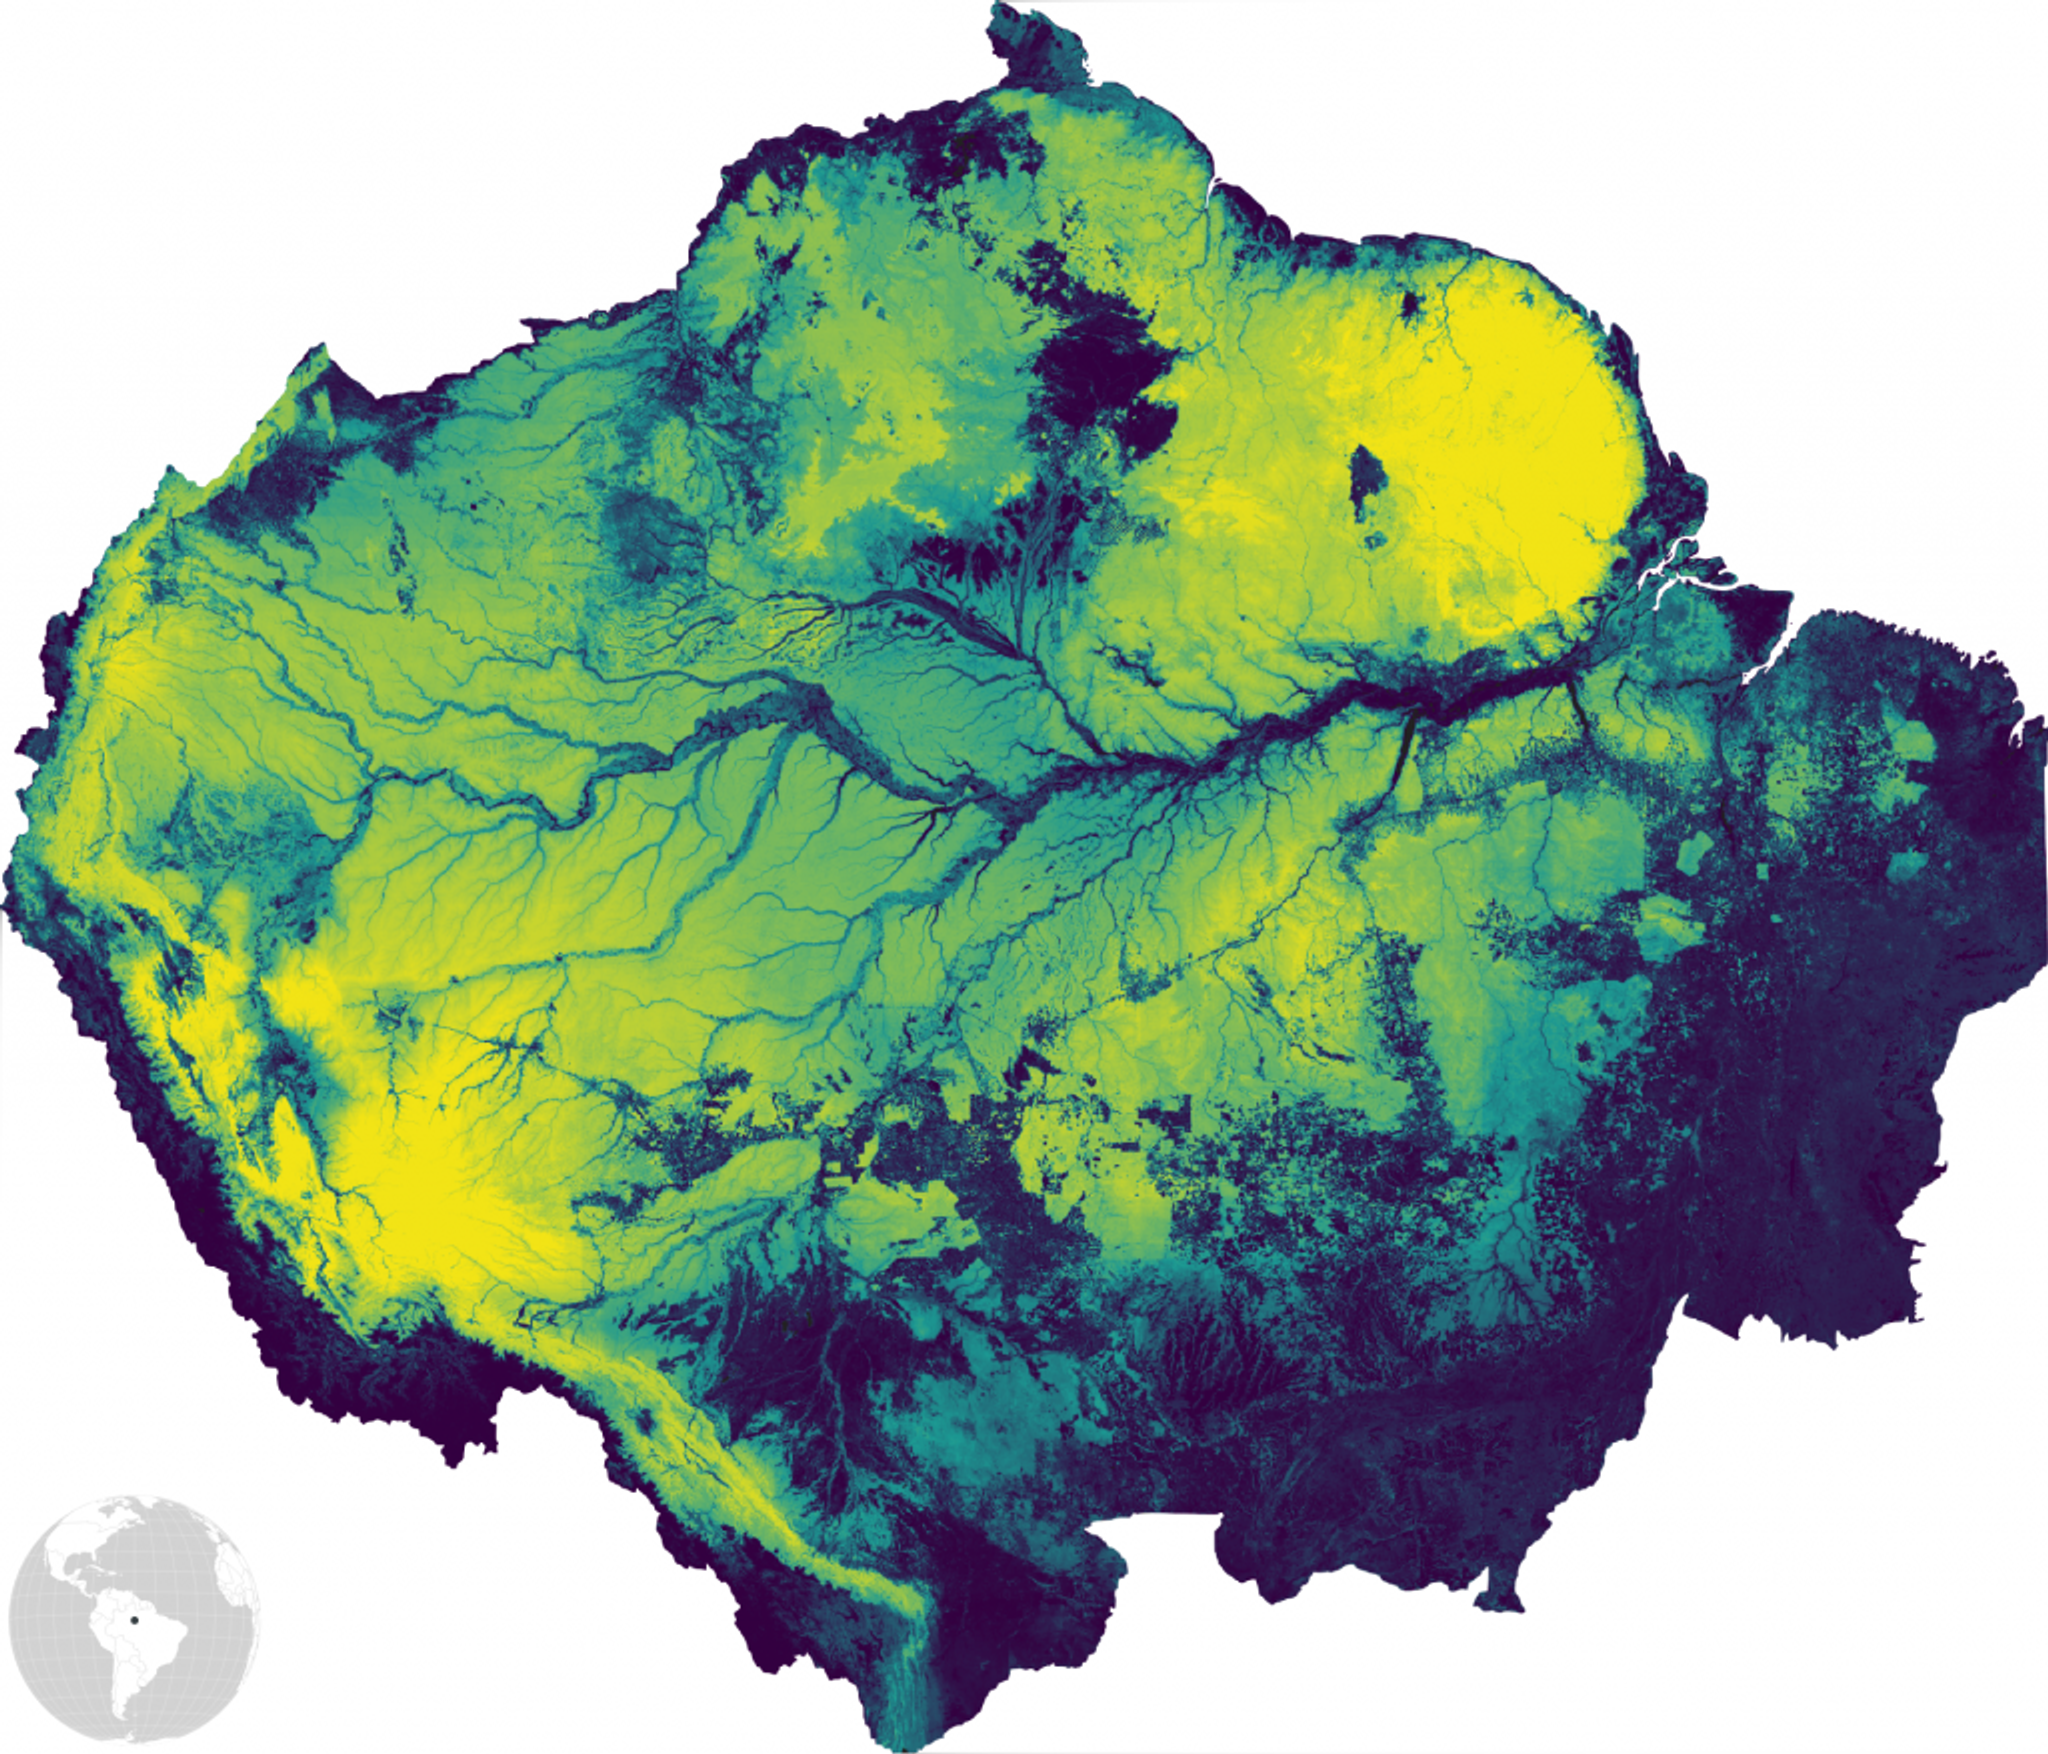
Aboveground carbon density in the Amazon Basin, one of the most carbon-dense regions of the world, whose network of rivers and terraces evoke comparisons to the circulatory system of the earth.
What’s in the report?
The report details intercomparisons with an array of independent biomass datasets. The analyses were designed to be reproducible by others, benchmarked with high quality reference data.
Why is the focus on intercomparison instead of validation? Because validation exercises assume that one source of data is an error-free measurement. Nearly all sources of biomass data are modeled estimates, not measurements, and all models include uncertainty. Even field plots use models to convert straightforward measurements like tree height and stem diameter into estimates of total biomass (which many field ecologists prefer over the direct measurement, which includes figuring out how to weigh each tree on a scale). Aggregating biomass estimates over large areas — in national forest inventories, for example — introduces additional sources of uncertainty.
Uncertainty is an inherent part of biomass modeling, and we embrace that. Since no one measurement method provides an error-free source of truth, we believe the best way to understand the quality of a biomass data product is to compare it to as many different types of data as possible, providing multiple views into where our data performs well, and where it faces challenges.
We modeled this intercomparison after a series of studies evaluating the quality of other global satellite biomass maps (Hunka et al. 2023, Armston et al. 2023, Dubayah et al. 2022). These authors designed their analyses so that satellite data producers can convey a comparable, reliable, and consistent message on global biomass estimation methods to create actionable policy impacts. Our team is aligned with this approach, and this report provides readers with direct comparisons to the analyses performed by these scientists.
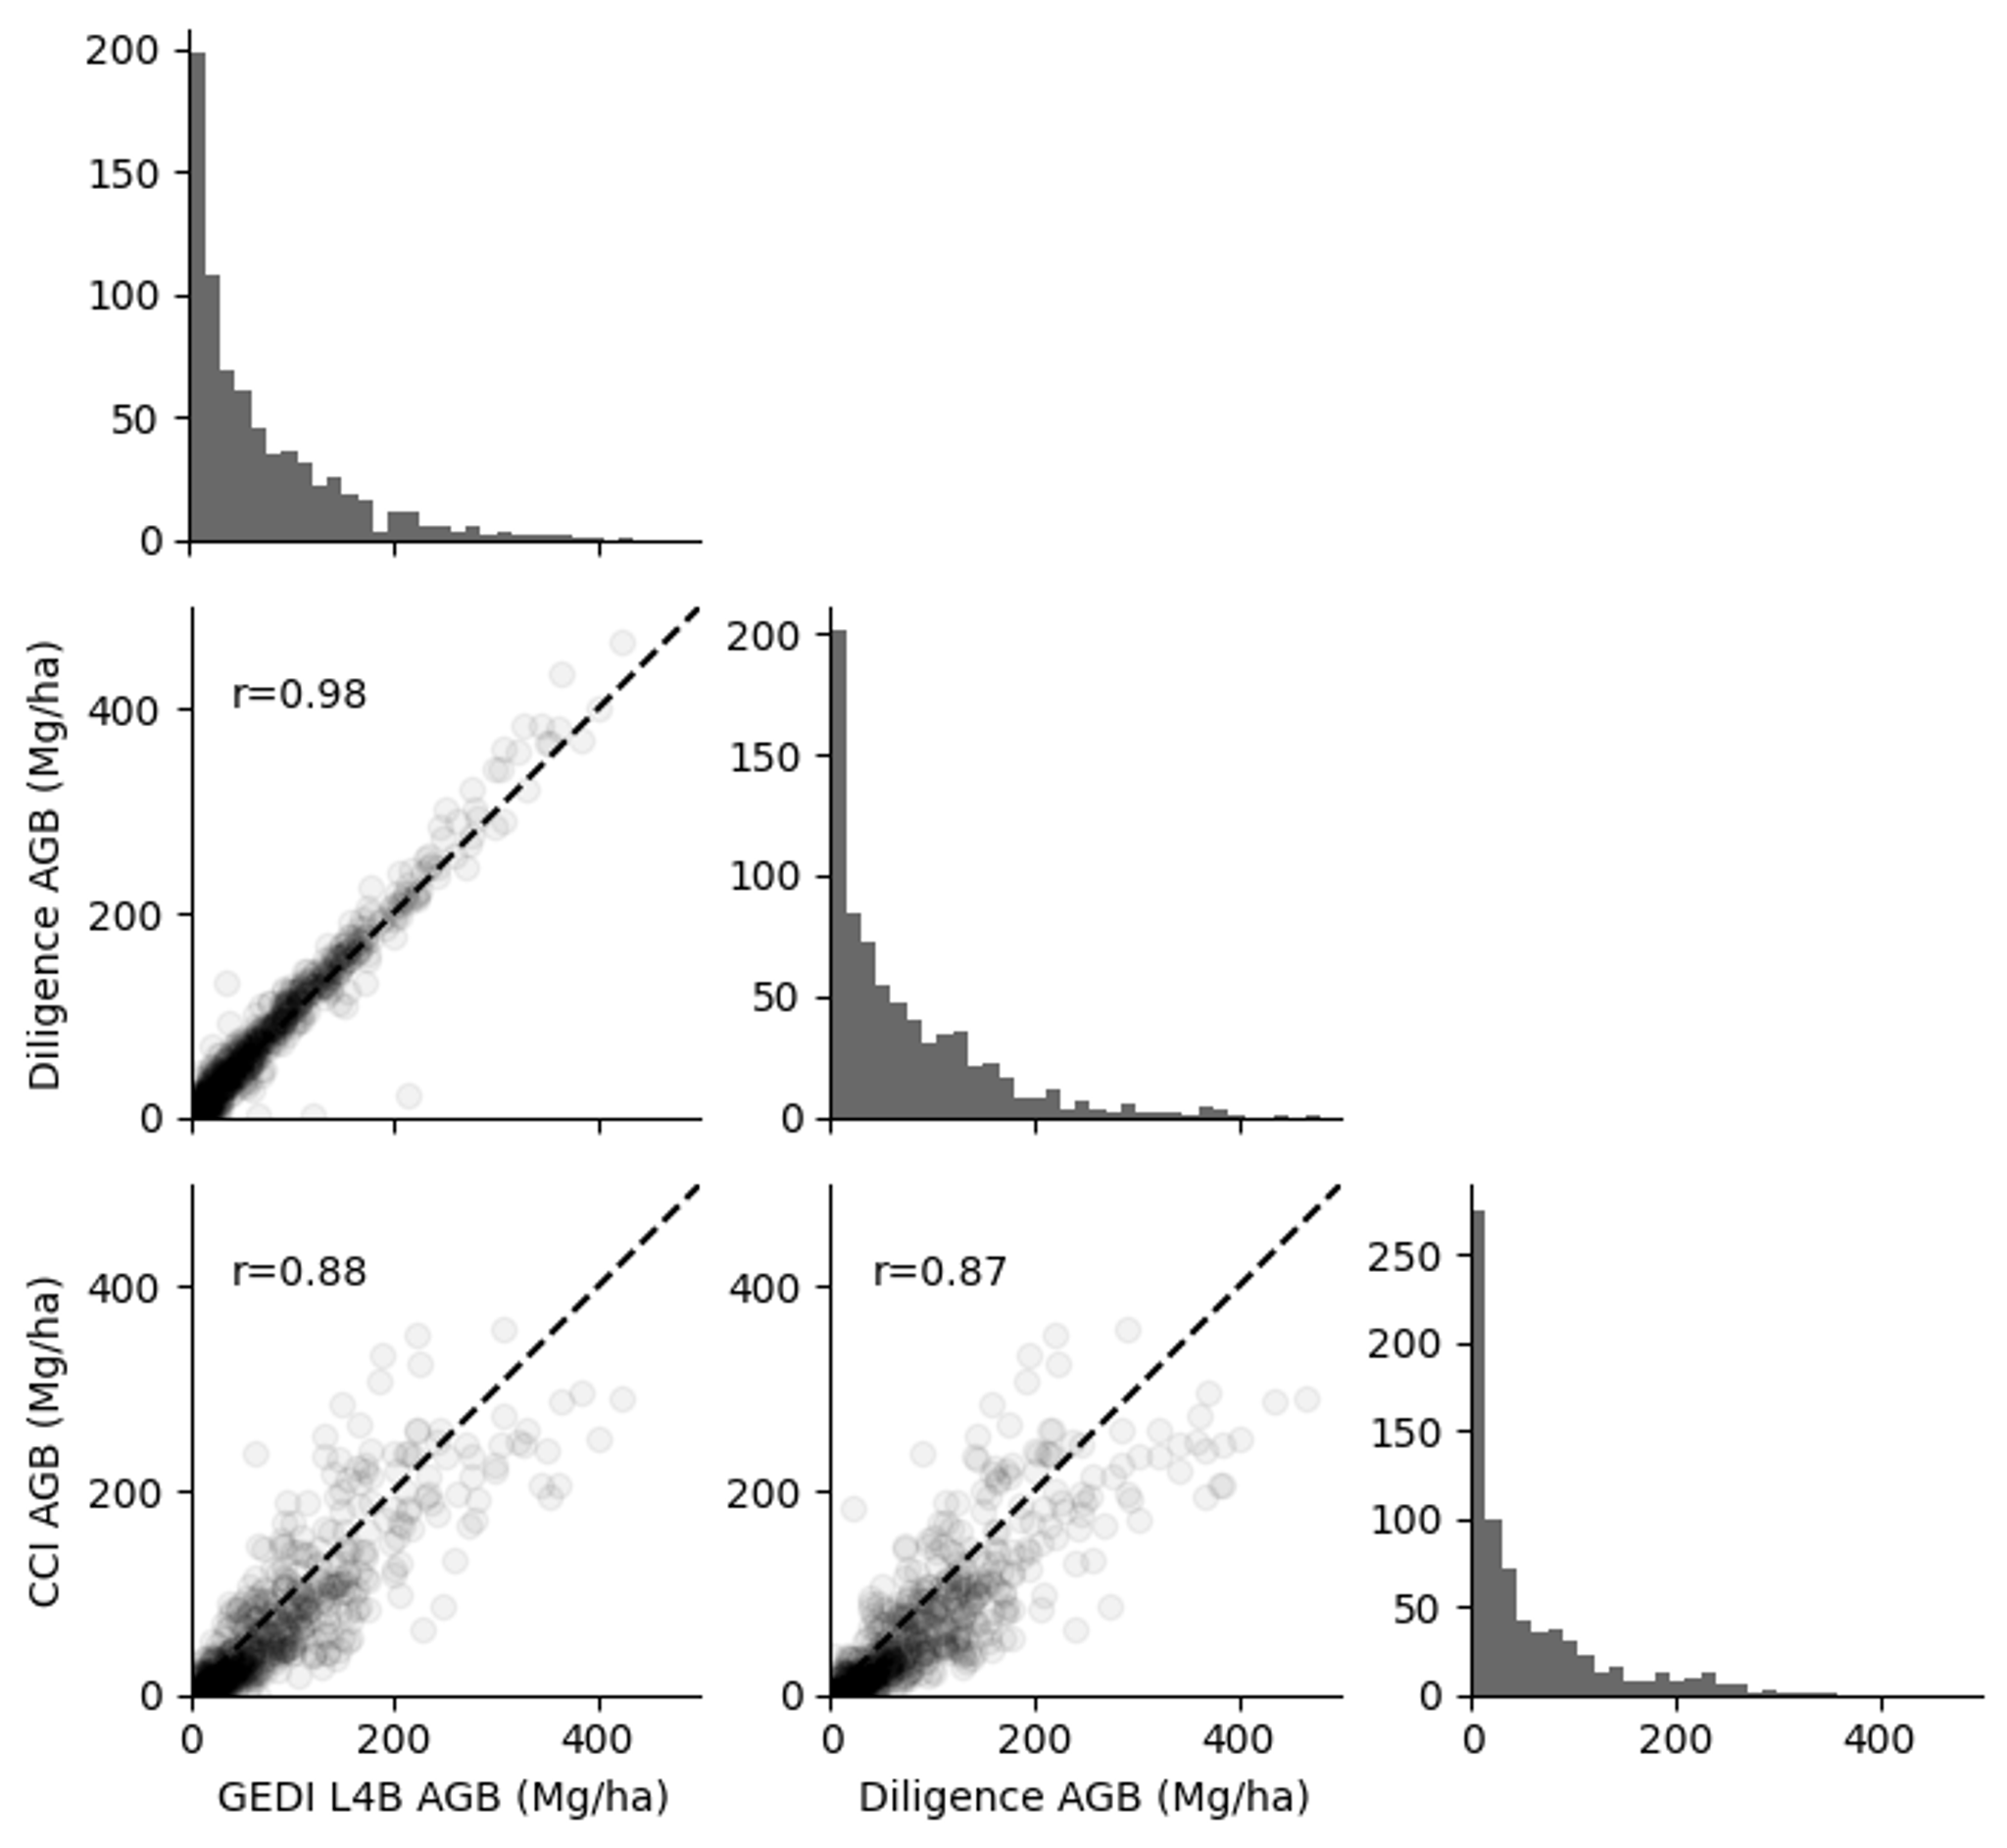
Pairs plot comparing mean AGB at the ecoregion level between Diligence, GEDI L4B, and ESA CCI. Plots along the diagonal show marginal distributions of AGB, and plots below the diagonal show ecoregions as points with Pearson correlations and dashed 1:1 lines. Each point represents one ecoregion.
What are the key takeaways?
- Model performance increases with spatial and temporal aggregation. Comparisons at the jurisdictional-scale and offset project-scale performed the best, which are the primary intended use cases.
- Performance is lower in pixel-level comparisons at US-NEON field plots, finding a bias towards low predictions in the most carbon-dense forests.
- Diligence shows strong agreement with global datasets, including NASA-GEDI, ESA-CCI Biomass, and UN-FAO country-level statistics.
- We find strong agreement with field- and project-based carbon estimates that aggregate over multiple pixels, like US forest inventory and project-level carbon offsets data.
- Model performance is not geographically uniform. Users are discouraged from interpreting performance numbers as indications of the expected accuracy for every pixel, and encouraged to interpret performance metrics as the expected accuracy of the global dataset.
How were the models trained?
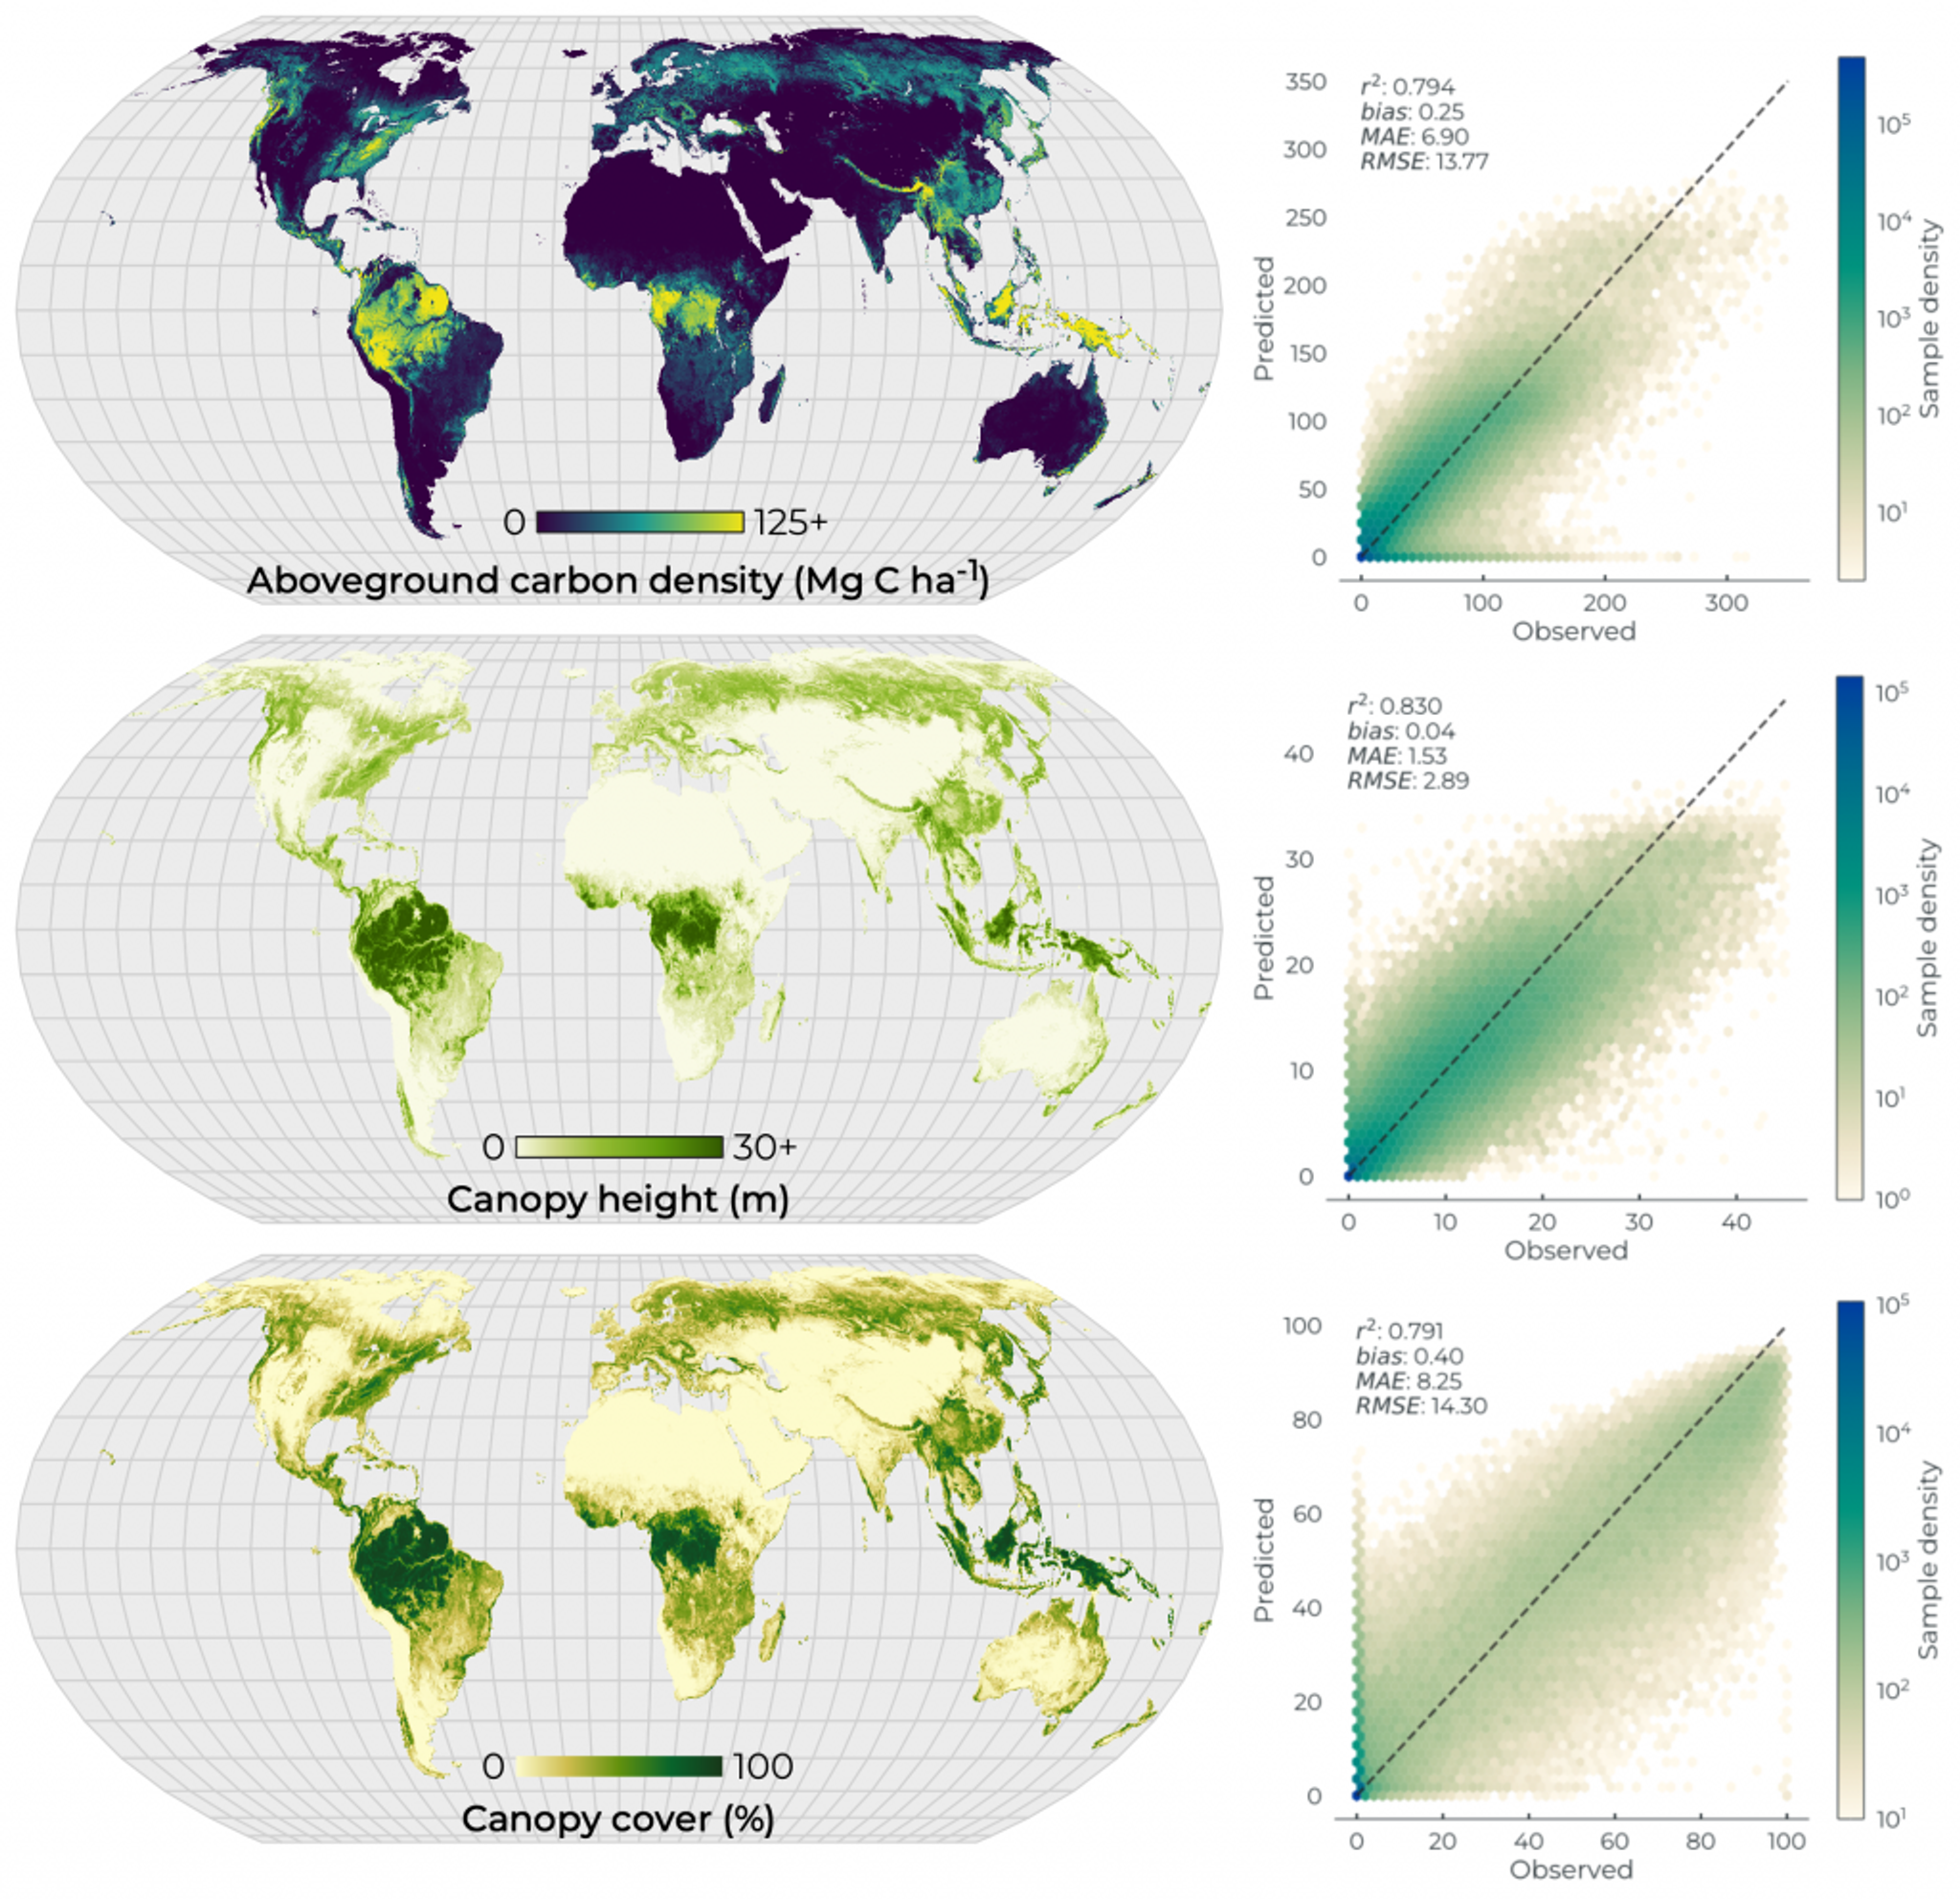
Global maps of Forest Carbon Diligence data (left) and training data performance numbers for each metric (right). We report strong performance across all metrics relative to the data we trained the models on, but comparisons to independent datasets provide a better estimate of generalization in model skill.
Diligence models were trained using several machine learning approaches.
We modeled canopy height and canopy cover first using a deep learning model, a custom U-Net designed for multi-sensor fusion, integrating satellite multispectral and SAR measurements. Because we build custom network architectures that span beyond the spectral depth of popular open-source pretrained networks, our models require lots of data to effectively learn the complex feature representations of global EO data. To feed this need, we processed a huge archive of permissively licensed airborne LiDAR data from around the world, working to ensure data representation along key global ecological gradients: latitude, elevation, biome, and land use intensity. This archive of training data is not totally unbiased, but we show our expected biases in the Diligence Tech Specs (figure 3), and are continuing to process new data over time, which will lead to future product improvements.
Boosted regression trees were used to model aboveground carbon density, but not directly from satellite multispectral and SAR observations. Let me clarify. The target response variable — footprint-level biomass data from the NASA GEDI mission — is indeed a satellite measurement. But we modeled biomass as a function of canopy height, canopy cover, elevation, and geographic location. This aligns our approach with traditional methods of carbon estimation, built on fundamental ecological theory, predicting that biomass varies directly in response to variation in forest structure. This approach allows the relationships between structure and biomass to vary with space and topography, which we estimate empirically based on the near-global footprint of GEDI measurements.
I refer to this approach as biomimicry: selecting, designing, and training machine learning models to approximate mechanistic ecological models. Our deep learning approach leans heavily on lessons from radiative transfer modeling, learning the multi-scale spatial relationships between spectral reflectance, backscatter coefficients, and forest structure. The regression tree model can learn to approximate allometric relationships in a way that is sensitive to multiple components of forest structure. This is easier to interpret, more mechanistically-driven, and more generalized than a model that estimates biomass from reflectance data.
Ten-year time series of aboveground carbon density over Amazonas, Brazil showing trends in forest loss in response to agricultural expansion. Year-to-year variation in undisturbed landscapes is also observed, an example of the temporal variance discussed in the section above.
What are some of the biggest current challenges?
Building global remote sensing products spanning a decade of data is tough. The team had to make a lot of design decisions that all involved tradeoffs in quality, cost, and complexity. We made choices to build the best product possible, but it is not perfect. Let’s talk about some of these challenges, and how we advise users to address them.
Removing clouds and haze from multispectral imagery is a perpetual challenge. We built an aggressive cloud masking algorithm for clear sky observations. This included a pixel selection algorithm that prioritized high quality observations and down ranked observations close to cloud edges. As a result, users can see circular buffers in areas where pixels were backfilled with lower quality observations. To mitigate this effect, we provide a pixel quality score dataset, as well as a day-of-year asset, which can be used to filter and remove low quality observations, or observations from distant points of the year.
Ranking pixel quality over many years means that some years will have higher quality predictions than others, meaning model predictions exhibit some amount of year-over-year variation. This variation was more pronounced on the initial Diligence product release, but these were mitigated to a large degree by the v1.1 release. We’ve found that the year-over-year variability is often within the model’s upper and lower prediction intervals, which are provided as an additional data layer. Users are advised to leverage the QA and uncertainty layers when interpreting these data, filtering observations by quality, and sampling statistically.
As a know-it-all grad student I used to grouse about global data products that looked right everywhere but weren’t right anywhere. In practice it is very difficult to build a global product with uniform quality, owing to the complex interplay between spatial and temporal biases, measurement variance, and parameter optimization approaches. We have approached this practical problem with practical guidance, providing detailed analyses of where prediction performance is lowest. This includes mapping prediction uncertainty at global scales, showing high uncertainty in the Asian Paleotropics, for example. We also share prediction uncertainty at local scales, showing model skill is lower when comparing field plot performance site-by-site as opposed to comparing all sites together.
As a result, users are discouraged from interpreting performance numbers as indications of the expected accuracy for each pixel, and encouraged to interpret performance metrics as the expected accuracy of the global dataset. One way that users can mitigate these risks is to fit their own biomass models using the Diligence canopy height and canopy cover layers, providing local precision that the global model may not capture.
Finally, the value of transparency goes two ways. These analyses have elucidated clear opportunities for future product improvements, and our team is committed to continuously updating this product with new scientific advancements and in response to user needs.
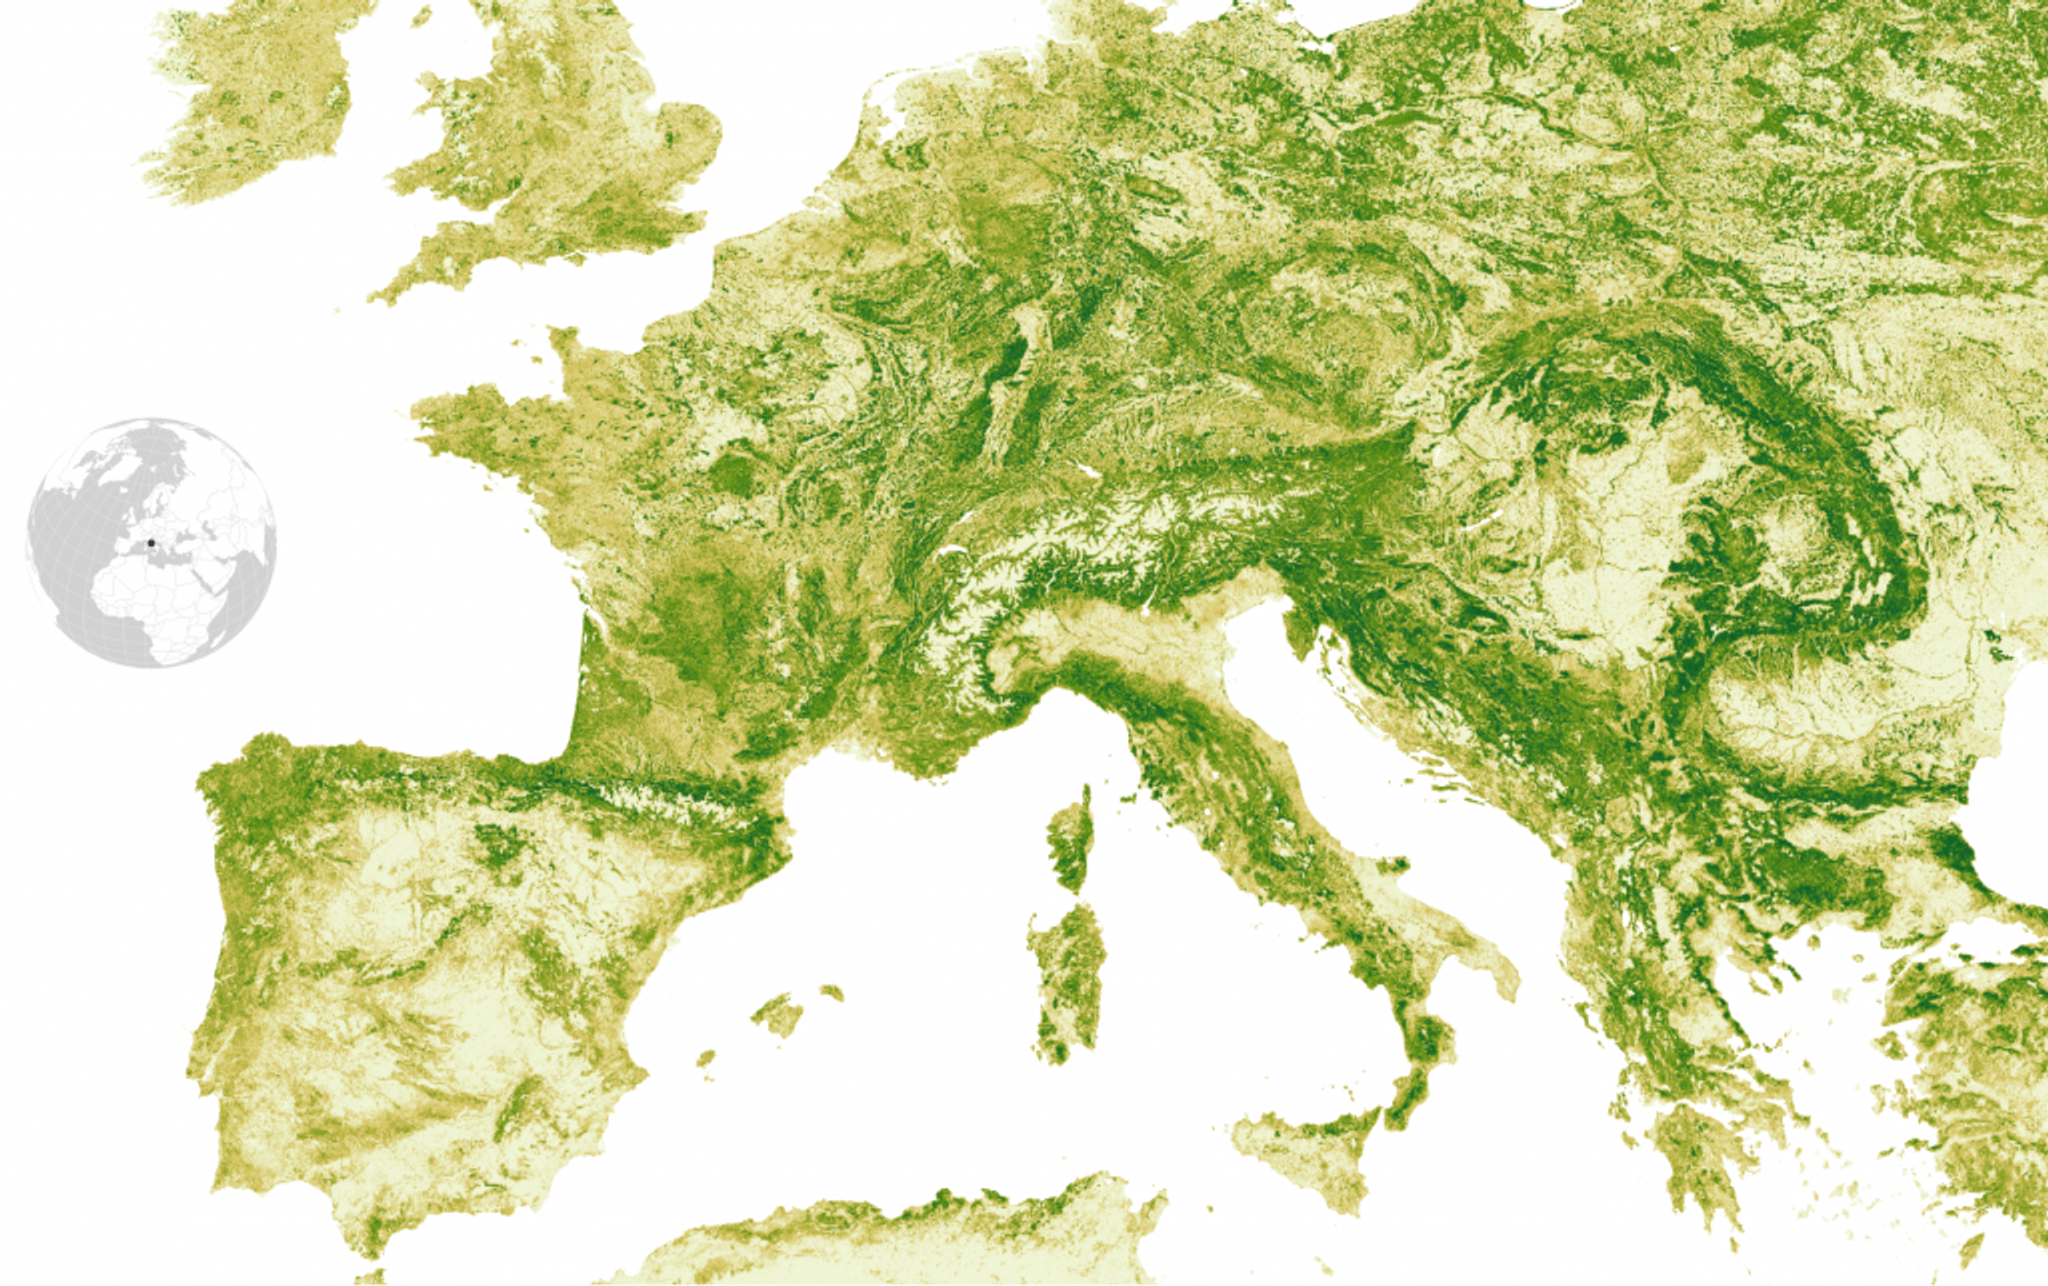
Canopy cover patterns across Europe reflect the complex geography of the region and are shaped — as all forests are — by interactions between climate, topography, people, and evolutionary history.
How does Diligence compare to other emerging commercial products?
It’s hard for us to say without bias. We’ve worked hard to build the best product available — innovating on the frontiers of earth observations, artificial intelligence, and forest carbon science — and we share this report to let users evaluate whether we hit the mark. As mentioned before, we designed our analyses to align with the global effort among satellite data producers to convey a comparable, reliable and consistent message on global biomass estimation methods in order to create actionable policy and market impacts.
This approach to open reporting is fundamentally important for establishing operational forest carbon MRV standards (monitoring, reporting, and verification). The release of an in-depth validation and intercomparison report should signal to users that the Forest Carbon Diligence product was designed to support this approach, and that we believe it is highly competitive with other products.
It is worth articulating that Diligence is designed and built as a product, which will change over time. The results in the Validation and Intercomparison report represent the quality of the product with this release, which we view as a baseline for future improvement. Our team will continue to innovate at the intersection of earth observations and forest carbon science to address the needs of our users.
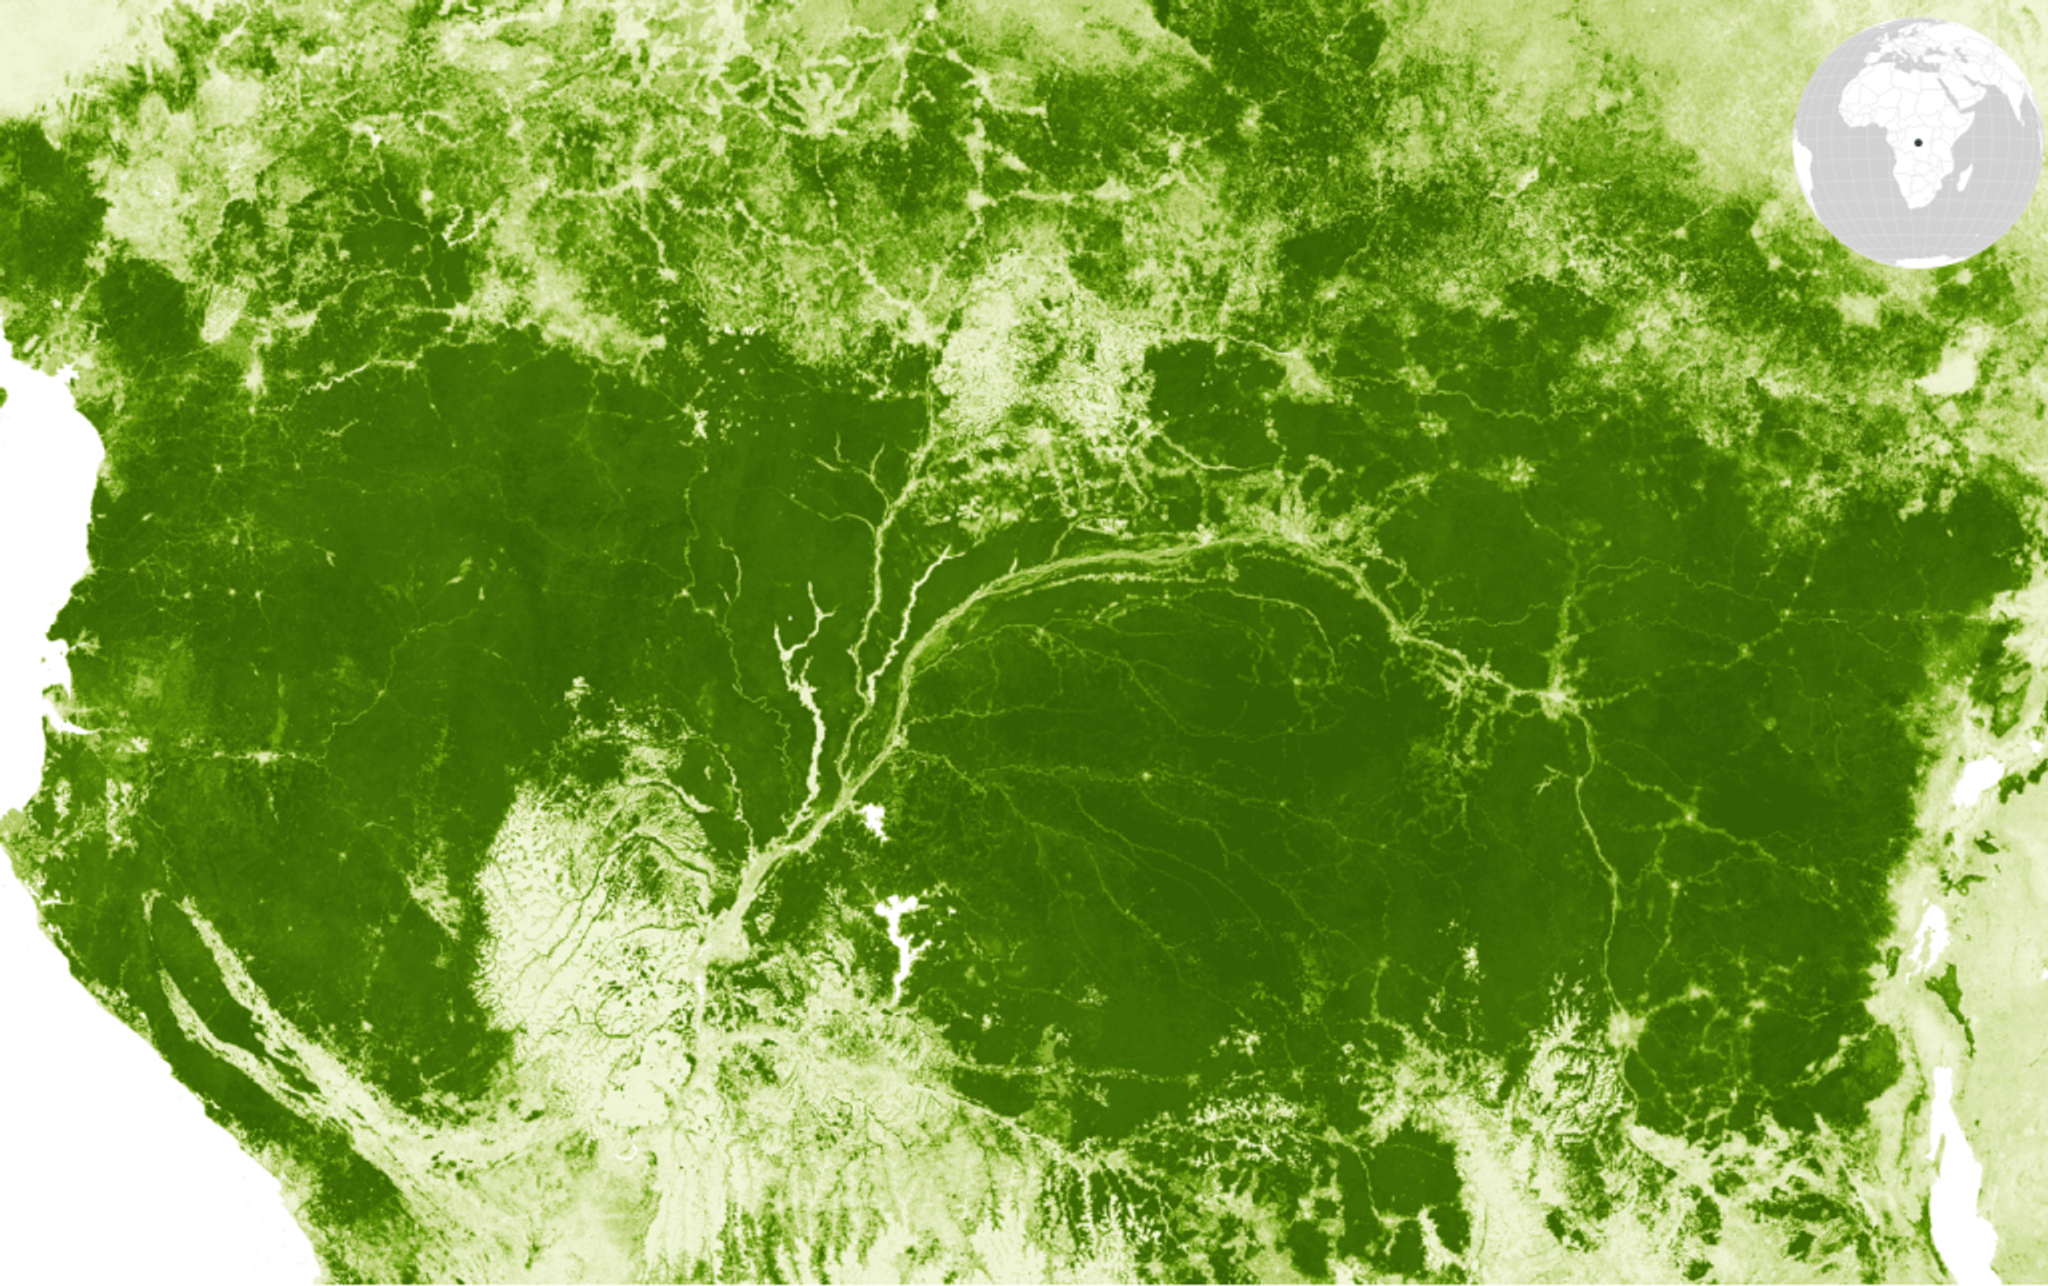
Canopy height patterns spanning the Paleotropical forests of the Congo Basin, one of the cloudiest regions in the world, and home to a stunning array of mammal biodiversity.
What’s next for the Forest Ecosystems team?
We’ll keep mapping forests in finer and finer detail, with more and more precision. The team is working now to build the Forest Carbon Monitoring product — which integrates data from Planet’s unique constellation of monitoring satellites — to produce regularly-updated, high resolution maps of forest carbon and forest structure.
Planet recently announced the Planet Insights Platform, which combines our analysis-ready data with cloud-based tools to allow users to efficiently analyze, stream, and distribute data at scale. Users can build workflows that solve important domain-specific problems, reducing the need to build complex analysis downstream from our data.
We see a ton of upside to integration with other Planetary Variables like Land Surface Temperature and Soil Moisture, which can help characterize drought stress and forest health. Integrations with Planet Monitoring data can provide additional visual and analytical data, providing users with additional contextual information.
Each of these advances should provide more high quality insights into how forests around the world are changing, equipping users with the insights they need to make informed decisions.
But in the short term? I think a stroll in the woods sounds pretty nice.
Ready to Get Started
Connect with a member of our Sales team. We'll help you find the right products and pricing for your needs.