
Imagery Delivery in the Subscriptions API

PlanetScope image of Castle Bravo Crater, Bikini Atoll, Marshall Islands. Captured December 8, 2023. © 2023 Planet Labs PBC. All Rights Reserved.
TechDeliver Planet data layers on Planet Insights Platform so you can leverage scalable and customizable imagery analysis tools.
A subscription is one way that Planet delivers data for you to use in your workflows. You specify an area of interest, a time of interest, and a data resource; in turn Planet will deliver all the data that matches your criteria. You can subscribe to receive historical data from the archive — or to receive imagery for ongoing monitoring as it is captured. You can use the Planet Subscriptions API to subscribe to Planet data layers including PlanetScope, SkySat, and Planetary Variables.
To make use of subscriptions in tandem with the full suite of imagery and statistical analysis tools on Planet Insights Platform, we have released a new capability that allows you to create subscriptions that deliver Planet data into imagery collections on the Planet Insights Platform.
To deliver Planet data to a collection on the Planet Insights Platform, you simply need to add a hosting block in your Subscriptions API payload that specifies “Sentinel Hub” as the destination for delivery. If you are currently using the Subscriptions API to deliver to your cloud storage, you will need to remove the cloud delivery block from your payload.
When you do this for the first time, a Sentinel Hub collection will be created for you. If you have an existing Sentinel Hub collection, you can select it as the destination instead. Check out the Planet Developer Center for all the specifics on how to use Sentinel Hub delivery in the Subscriptions API.
Note: Planet also offers the Orders API for discrete imagery orders as opposed to the continuous delivery that the Subscriptions API offers. The Orders API does not support direct delivery to Sentinel Hub today. If you need to use the Orders API with Sentinel Hub, please use the Third Party Data Import API ordering workflow.
Why Deliver Planet Data to Sentinel Hub?
If you are new to using Sentinel Hub, but are familiar with using the Planet Subscriptions API — here’s a quick overview of some of the reasons why you should deliver Planet data to Sentinel Hub.
Cloud Imagery Management
Sentinel Hub is a cloud-based and API-first platform for analyzing Earth observation data at scale. After delivering data to Sentinel Hub, you can use the platform to immediately start analyzing Planet data. You don’t need to worry about building cloud infrastructure for data storage, ingestion, cataloging, analysis, or streaming.
Once data is ingested into Sentinel Hub it’s first indexed and cataloged in a STAC-compliant Catalog API that you can use to search for data spatially and temporally.
Imagery Processing
Once data you order is delivered to the platform, you can start to analyze it immediately. You can write scripts that can be used to filter data, mosaic images, perform band arithmetic, and more. You have full access to a JavaScript code editor where you can customize the output of your analysis. You can find inspiration for types of analysis that are possible from our custom scripts webpage.
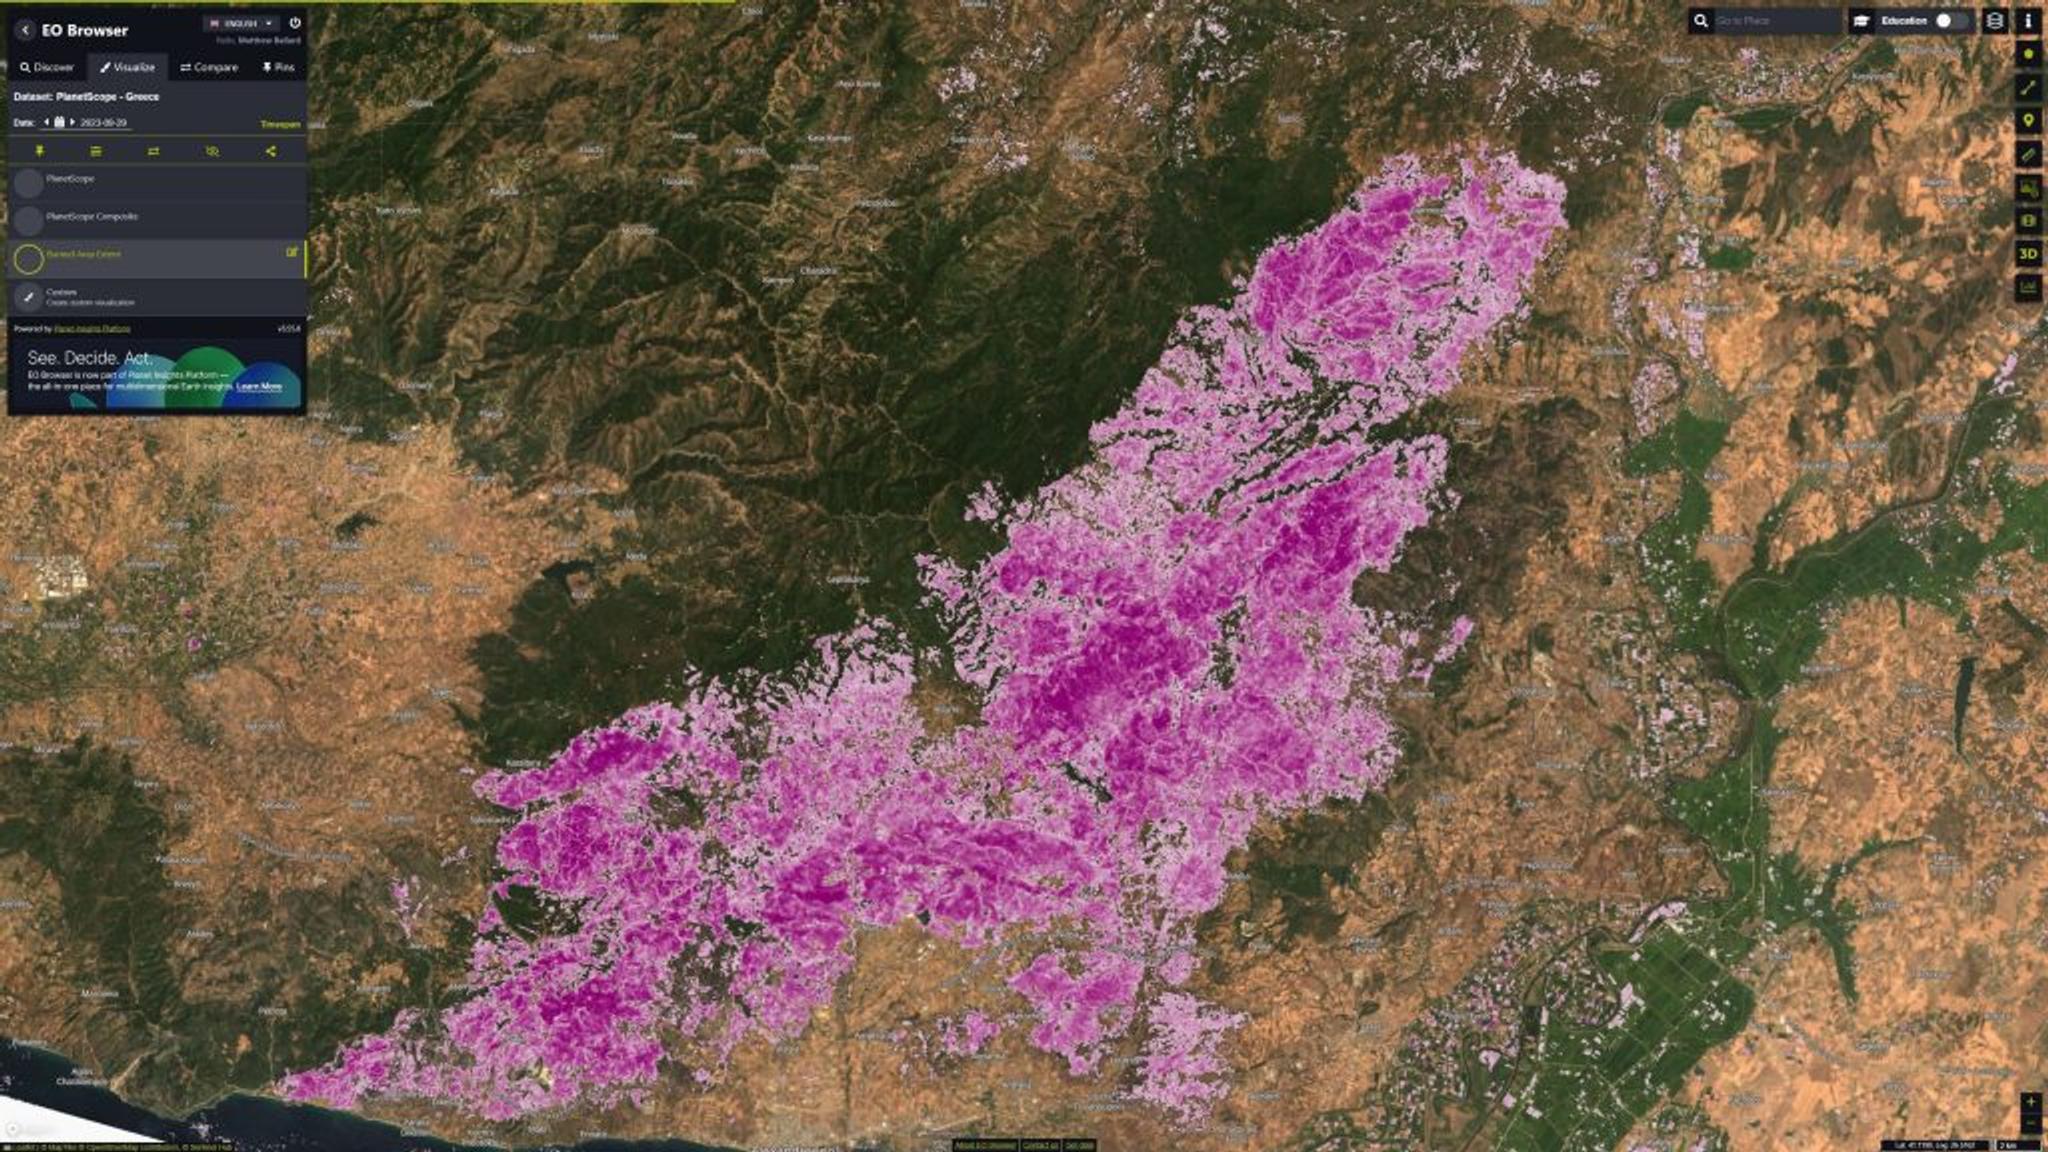
Burned area from a wildfire in Greece delineated using a custom script in EO Browser.
Statistical Analysis
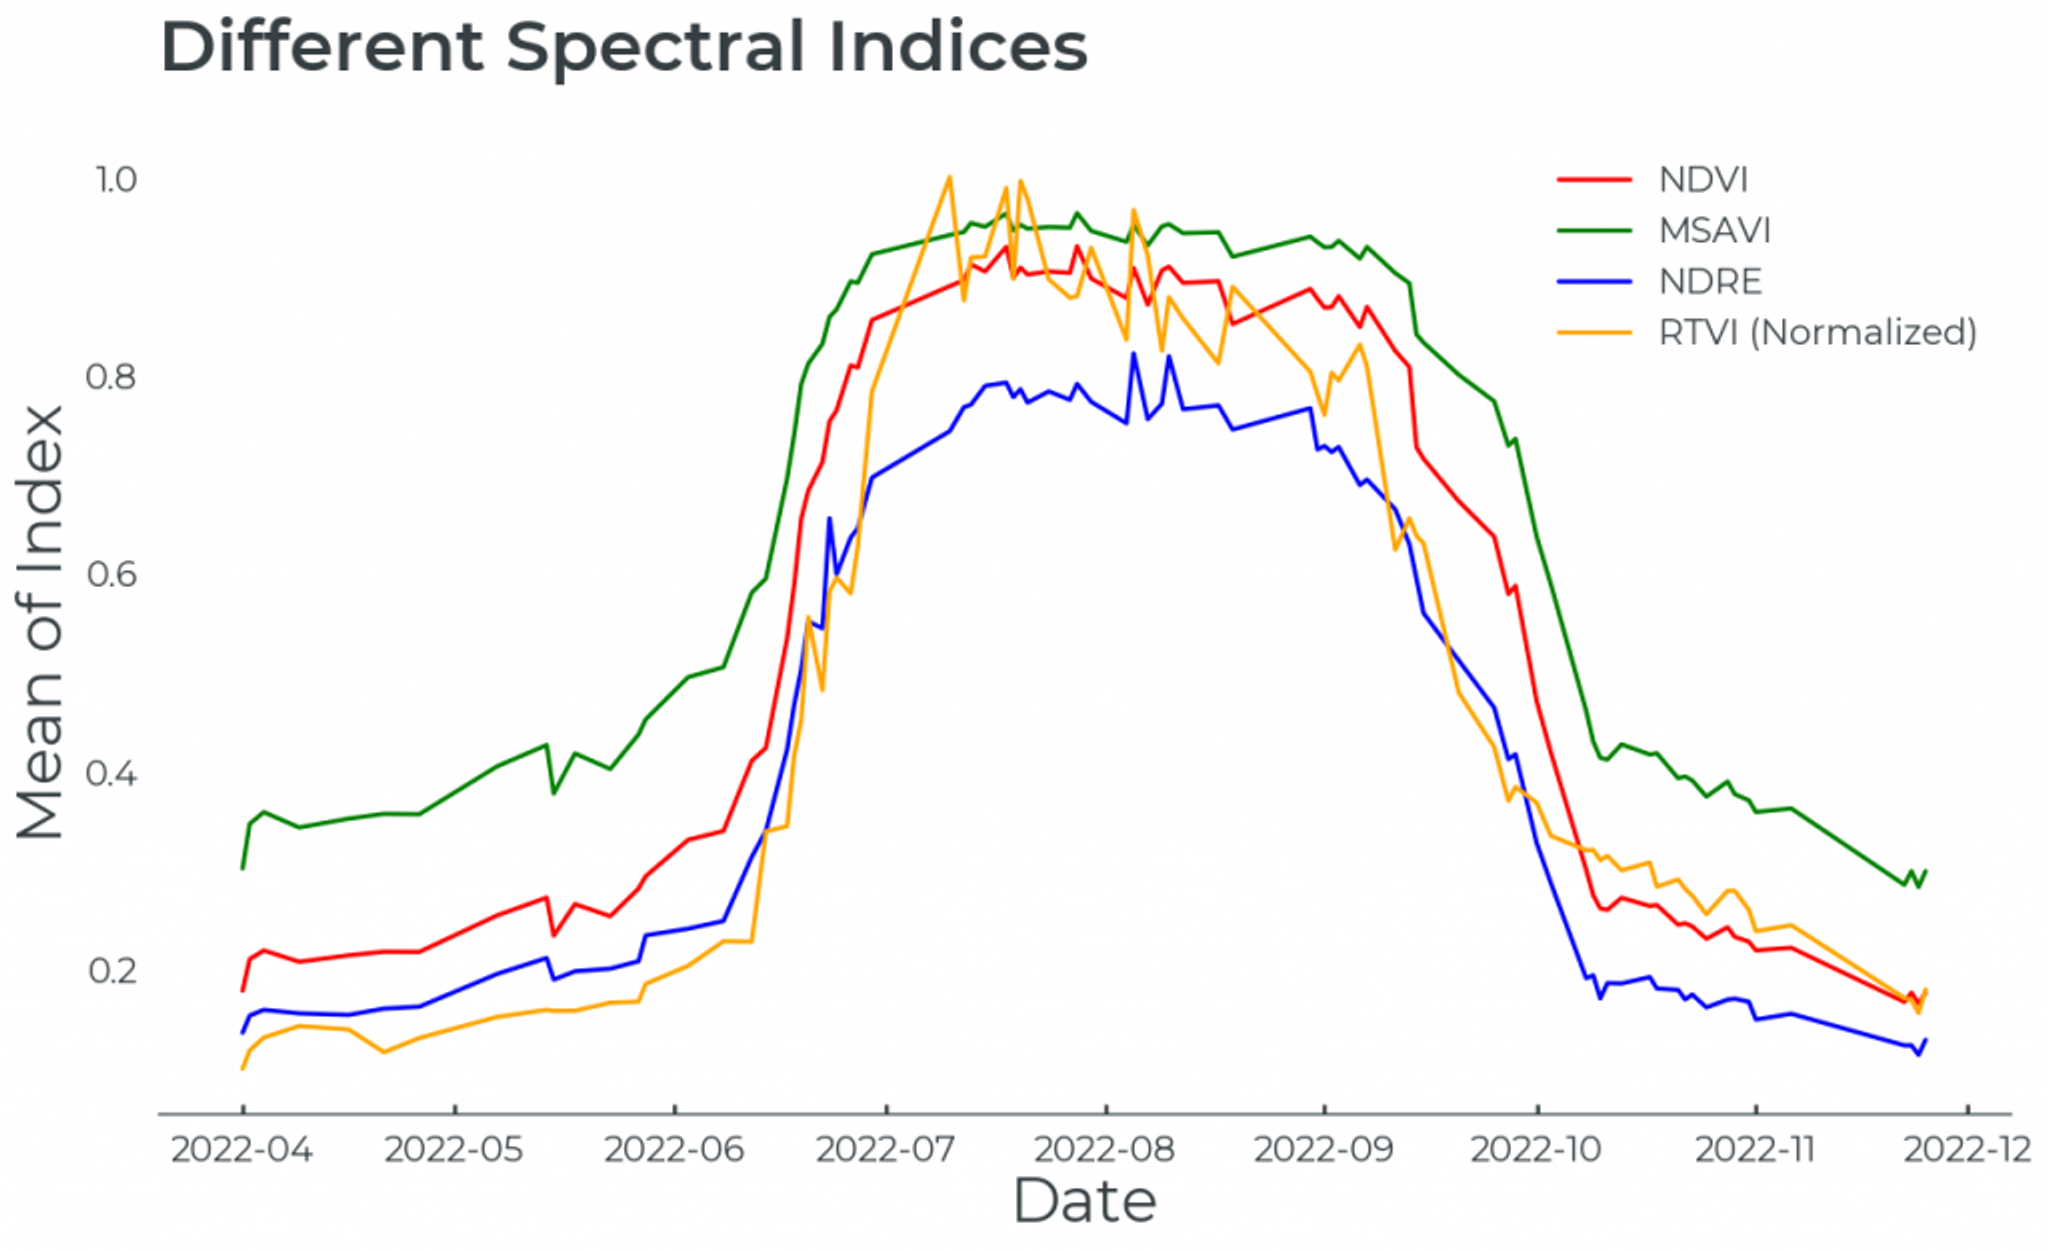
PlanetScope provides daily imagery, making it useful for monitoring change over time. One way to do that is through spectral indices, such as the Normalized Difference Vegetation Index (NDVI). But you can also access all eight spectral bands of PlanetScope, and the Usable Data Mask, to calculate any spectral index.
With a spectral index calculated, you can process it to generate a map — or you can request summary statistics over a smaller area of interest, like an agriculture field, to get the average of your index. If you want to learn more about agriculture indices with Sentinel Hub and PlanetScope, check out this webinar about updates in Sentinel Hub. Or if you prefer to learn by doing, you can use this code sample to see how to generate a chart like the one below.
Planetary Variables are another type of Planet data that you can subscribe to in Sentinel Hub. These are data layers for Land Surface Temperature, Soil Water Content, Crop Biomass, and Forest Carbon. Each of these provide a deep archive going back several years with high-temporal resolution (except Forest Carbon which is an annual dataset).
In order to make sense of these broad datasets with large time stacks, you can use the Statistical API to summarize the data. For example, you could use these datasets to monitor deforestation over time in a rainforest, track the impacts of drought due to climate change, quantify the effects of regreening efforts on temperature, or measure crop productivity.
Below is an example of statistical analysis with Land Surface Temperature data to look at climate anomalies. The land surface temperature of 2023 is compared to the prior four-year mean to highlight months that are abnormally warmer or colder. To learn more about how this analysis was done check out our blog on Planetary Variables in Sentinel Hub.
Time series plot (left) for the area of interest outlined on the map (right). The map shows the temperature anomaly on a given day for that location compared to prior four years.
OGC Streaming
If you need to integrate imagery into your GIS or mapping workflows, you can use the OGC (Open Geospatial Consortium) API to stream imagery into clients that support WMTS and WMS standards.
The OGC API is extensible — allowing you to dynamically adjust the range of dates and the renderer that should be drawn on your maps. This means you can easily build cloud-native integrations, streaming imagery directly from Planet Insights Platform into your applications. Below is an example of streaming OGC services into ArcGIS Experience Builder. You can find the code sample for this demo or watch our webinar to see the demo.
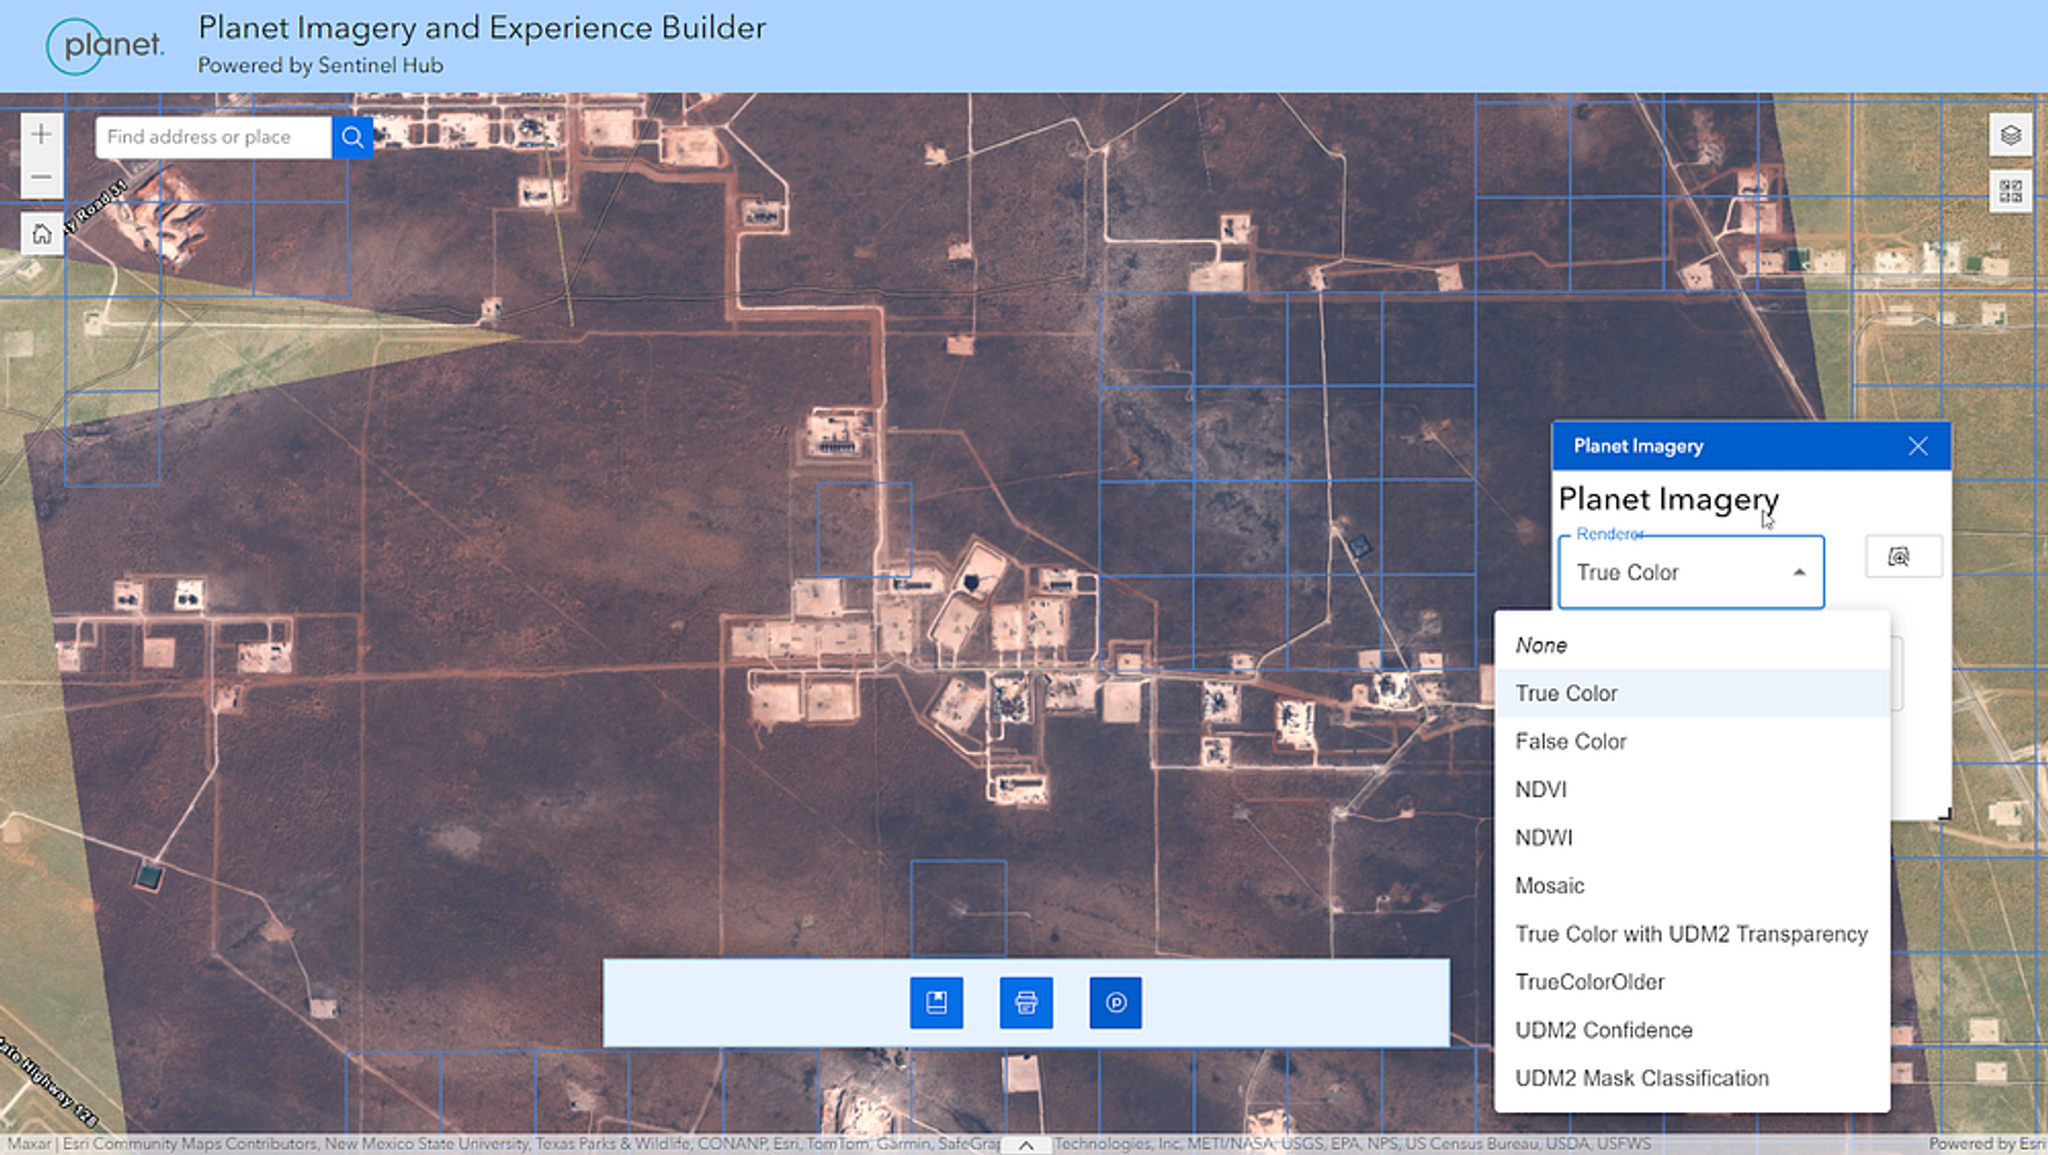
Planet OGC API being used to stream SkySat imagery into ArcGIS.
How to Get Started
If you already have a Planet account and are using the Subscriptions API you can get started with Sentinel Hub right now by creating your account.
If you don’t already have a Planet account you can reach out to talk with us. Or you can get started by purchasing access to Planet data.
And if you have questions about using APIs with Planet Insights Platform, reach out on Planet Community!
Ready to Get Started
Connect with a member of our Sales team. We'll help you find the right products and pricing for your needs.